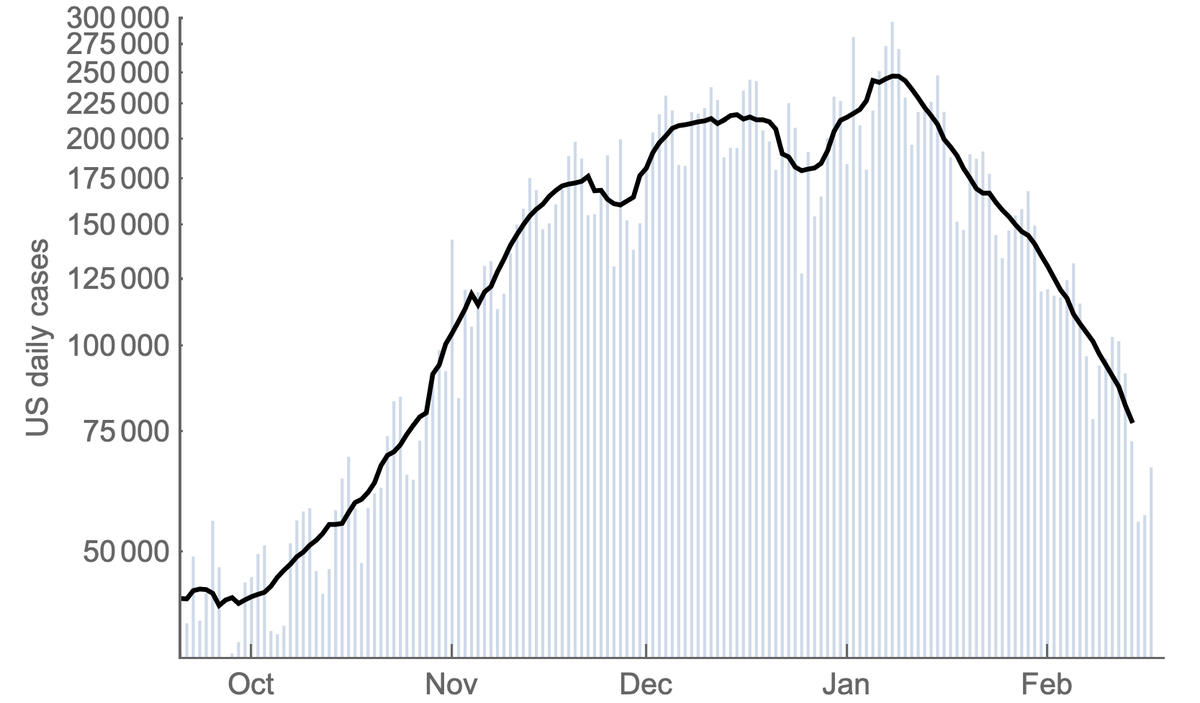
After a ~2 month plateau from mid-Nov to mid-Jan, the US #COVID19 epidemic has undergone a steady week after week decline and is now back to daily case counts last seen in late October. A thread on what we might expect going forwards. 1/13
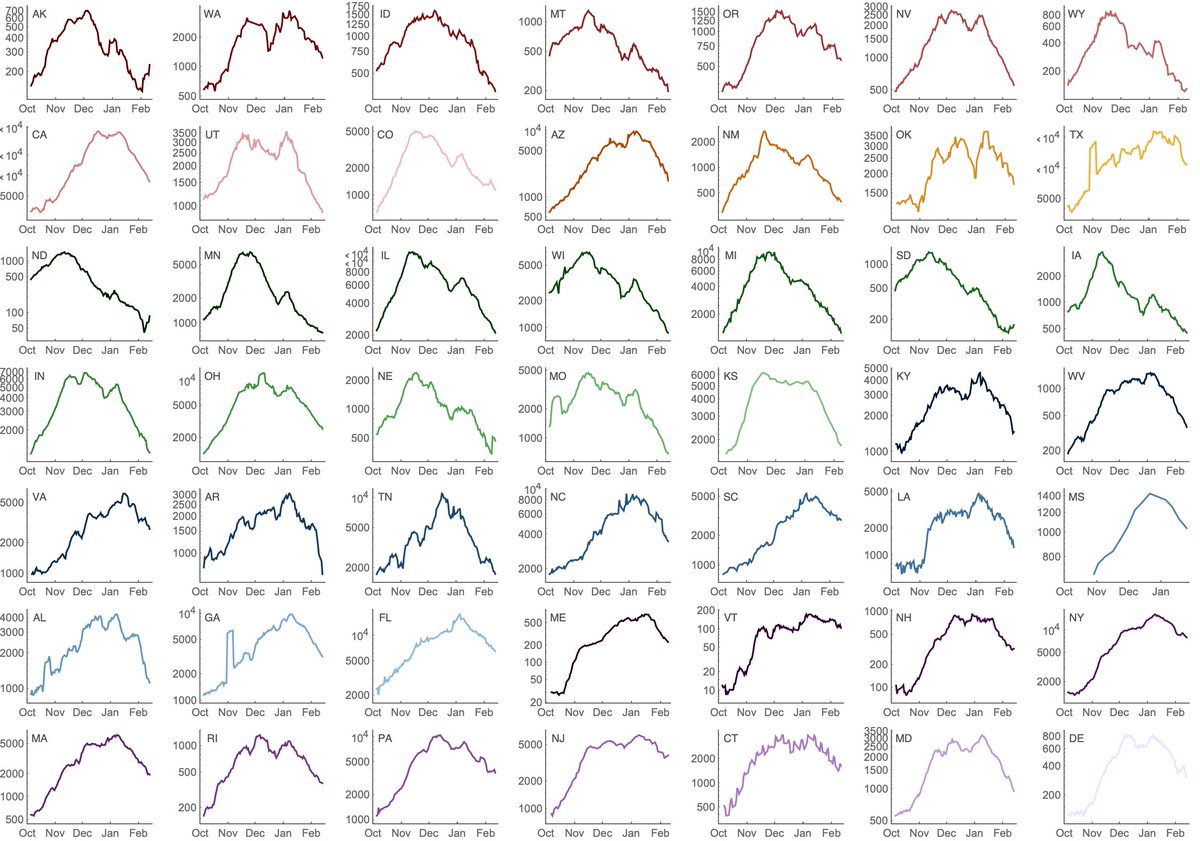
Working with case counts from @COVID19Tracking and Rt estimates from https://epiforecasts.io , I'm showing US confirmed cases broken out by state alongside transmission rate as measured by Rt through time. 2/13
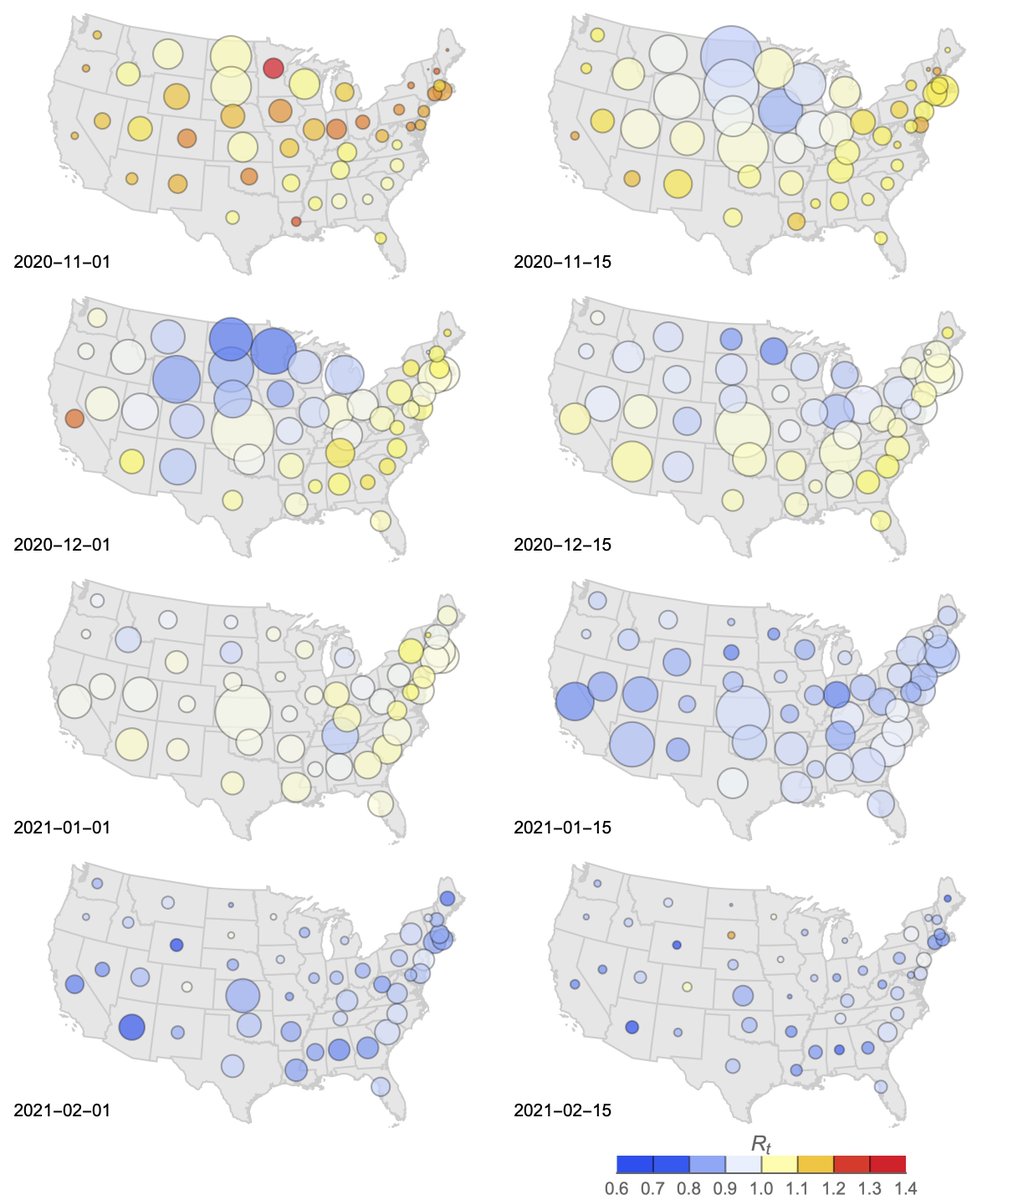
Generally, Rt > 1 in Nov and Dec corresponding to rising cases and drops below 1 in Jan corresponding to falling cases. We've seen a steady decline in Rt from Nov to Feb. Thus, current decline is not a sudden shift in circumstance, but resulted from reaching Rt < 1. 3/13
The US fall/winter epidemic is illustrated here as a series of twice monthly snapshots with bubble size representing per-capita case counts in a state and bubble color representing Rt, where red indicates growing epidemics and blue represents declining epidemics. 4/13
This shows "inflation" in Nov and Dec followed by "deflation" starting mid-Jan. The Dakotas and surroundings show a similar trajectory to other states, but were ahead of the curve with an epidemic peak in Nov. 5/13
Solely based on continued improvements to seasonality and continued increase in population immunity due to natural infection and vaccination I'd expect this trend to largely continue and the US fall/winter surge to be brought further under control. 6/13
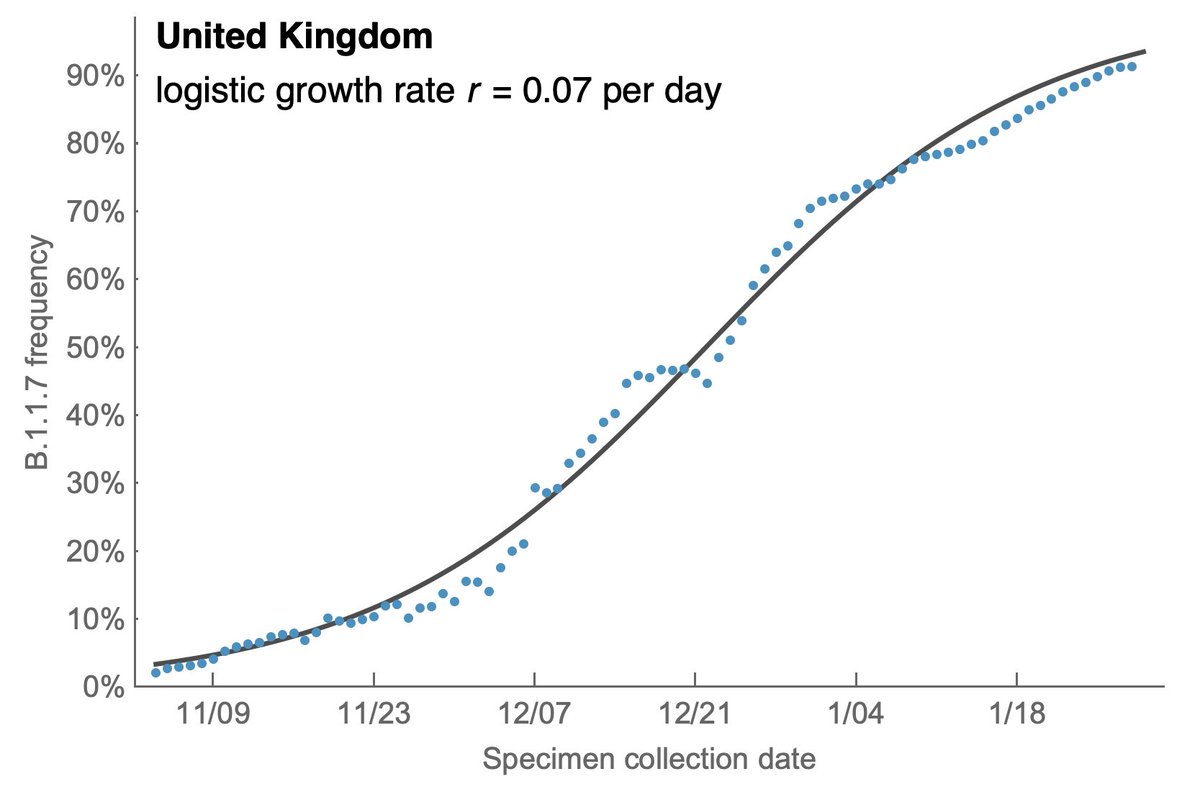
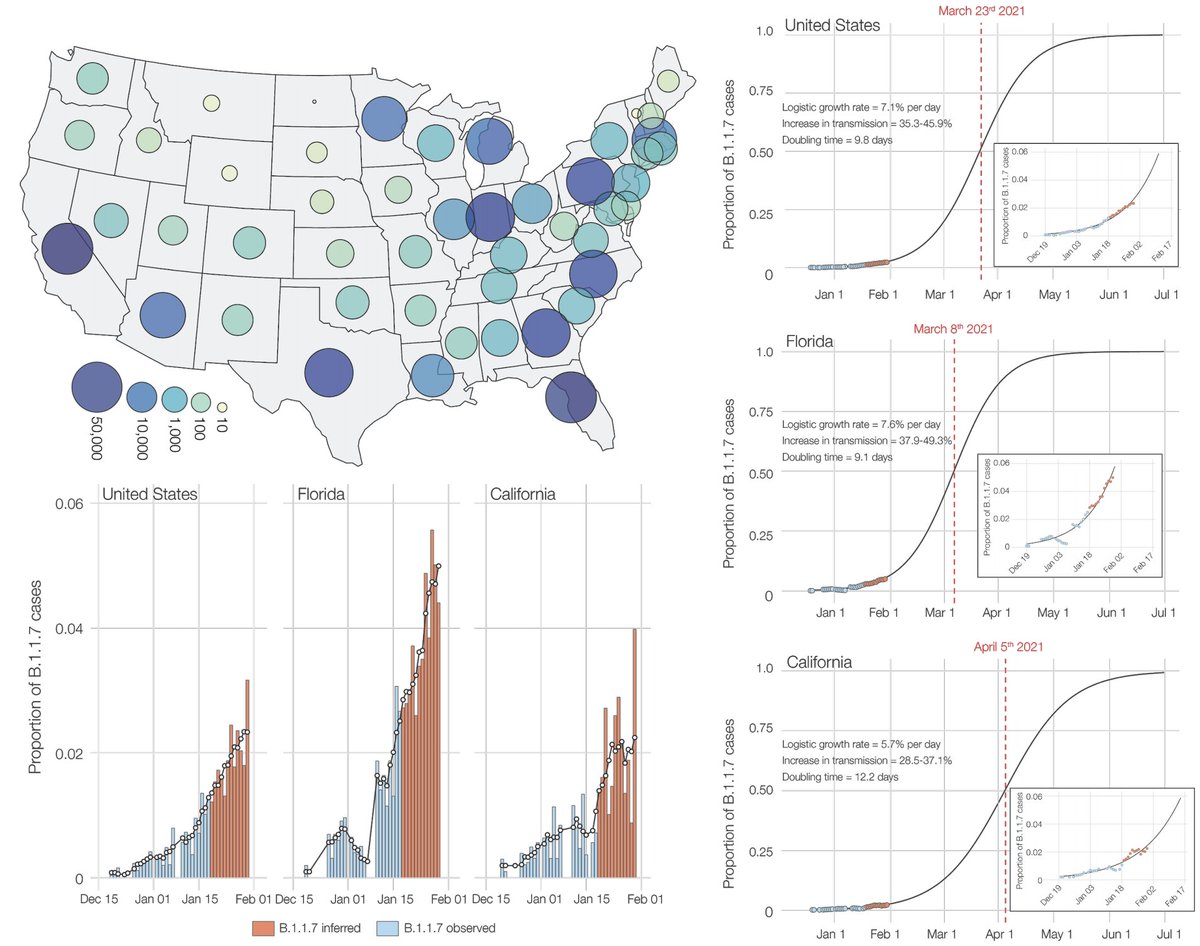
However, the rapid take-off of B.1.1.7 will push against these gains. The trajectory of B.1.1.7 in the UK decently fits a simple logistic growth model with a growth rate r of 0.07 per day as assessed using SARS-CoV-2 genome data from @GISAID. 7/13
A similar rate of growth of B.1.1.7 is observed in Denmark and Switzerland with Denmark reaching ~20% B.1.1.7 frequency and Switzerland reaching nearly 20% B.1.1.7 frequency at the end of January. 8/13
Recent work from @genesareclever, @gkay92, @K_G_Andersen and colleagues looking at B.1.1.7 in the US ( https://www.medrxiv.org/content/10.1101/2021.02.06.21251159v1) estimated a similar rate of frequency increase, which suggests B.1.1.7 will reach 50% frequency in the US by perhaps late March. 9/13
However, current prevalence differs across states and B.1.1.7 may become dominant in some areas of the US earlier than other areas. 10/13
It's not clear to me at this point whether biological increase in transmissibility of B.1.1.7 will "win" against further improvements to seasonality and immunity in ~6 weeks time at the end of March. 11/13
Increased transmissibility of B.1.1.7 will certainly stretch out circulation of COVID-19 and make it harder to bring under control relative to the non-B.1.1.7 scenario, but I'm not sure at this point how much of a spring B.1.1.7 wave to expect. 12/13
I do think this will become clear shortly as we observe what happens in countries like Denmark and Switzerland or states like Florida which are farther along on their B.1.1.7 trajectories relative to the US as a whole. 13/13

 Read on Twitter