Been thinking about where we are, where we might be going, what effect vaccines might have and how to tell. This thread may not happen all at once, and will get a bit mathematical in a couple of places (sorry!), but I will put in pictures. It's yet another argument for log scales
First of all, since not everyone seems clear on this. Lockdown is working. Cases are falling. Here are (7 day averages) of cases in England, by date of announcement, and the trend is clear.
And, like a million times since March, we plot it on a log scale, draw a straight line and find the slope. Looks like a 3.8% daily fall, 24% weekly fall (or R=0.78 on REACT parameters).
However, it's worth noticing that the actual values are still far too high.
However, it's worth noticing that the actual values are still far too high.
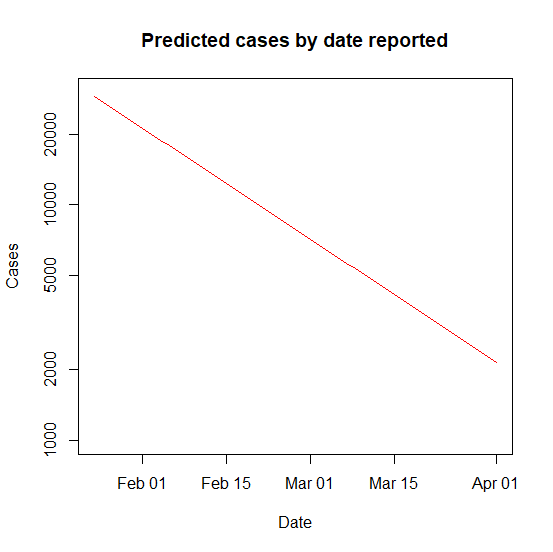
Nonetheless, we probably believe that this will continue. Fixed levels of lockdown should give fixed rate of decay, and so we can tentatively extrapolate the straight line.
We'll get there, but it takes a long time: would be 10,000 cases mid February, but still 2,000 by April 1.
We'll get there, but it takes a long time: would be 10,000 cases mid February, but still 2,000 by April 1.
Right, time for some maths. Why do we use a log scale? Because we believe there are multiplicative effects. Each day, we expect the number of cases to be multiplied by the same number, say (1-g).
So, if we start with C cases, a day later we'd have C times (1-g) ..
So, if we start with C cases, a day later we'd have C times (1-g) ..
After two days C times (1-g) squared and so on. On day T, we'd have C times (1-g)^T. So, if we take logs, and use the fact that log(1-g) is basically -g (for small g), the log of the number of cases would be
constant - g times T,
exactly like we see on the graph.
constant - g times T,
exactly like we see on the graph.
Except, of course, that was the story last April. Now, there's a new kid in town. Jabs Army. Jabba the Hut. Jabba Ranks. So, what effect is that going to have?
Again, we can make a simple approximation. We'll imagine that we inject the same number of people every day, so the total number of people protected is growing every day. (Obviously the more jabs the better, but a similar analysis would work if we continue to ramp things up).
Suppose every day a proportion c of the population is newly protected (this isn't exactly the number of people we jab, because it takes a while, protection isn't perfect etc, but we can just think about the number of vaccines that actually work).
So, on day 1, it's not C x (1-g) cases, it's C x (1-g) x (1-c), because a fraction of people who get coughed at are now immune.
But on day 2, more people are now immune, so the number of cases is C x (1-g)^2 x (1-c) x (1-2c)
But on day 2, more people are now immune, so the number of cases is C x (1-g)^2 x (1-c) x (1-2c)
There's a virtuous circle: as time goes on and we jab more people, we multiply by a better factor each day.
But basically, doing the same trick with logarithms, instead of the graph being a straight line, it should come down steeper and steeper (quadratically, maths fans).
But basically, doing the same trick with logarithms, instead of the graph being a straight line, it should come down steeper and steeper (quadratically, maths fans).
Ok, that's enough maths. Time for some pictures. This is obviously into Vallance "scenario not a prediction" territory, but I think that the answer is that the vaccines could have a noticeable effect fairly soon.
For example, if c = 0.001 (so 0.1% of the population are newly protected per day, or 55,000 people in England, which seems pretty conservative), then the plot looks *much* better - maybe sub 1000 cases in early March?
Now, obviously nobody knows what c is (with a more pessimistic value the curve isn't quite as steep). And I'm assuming that vaccination starts to have an effect soon (maybe it starts later). But the point is that the picture should be similar regardless.
But I think the point is that:
1. It's reasonable to think that vaccines might have quite a dramatic effect on case numbers in the medium term. Probably enough that we get to a stage where the debate becomes about opening up based on case numbers relative to levels of immunity.
1. It's reasonable to think that vaccines might have quite a dramatic effect on case numbers in the medium term. Probably enough that we get to a stage where the debate becomes about opening up based on case numbers relative to levels of immunity.

 Read on Twitter


