Latest @ICNARC report on intensive care admissions and outcomes has been published.
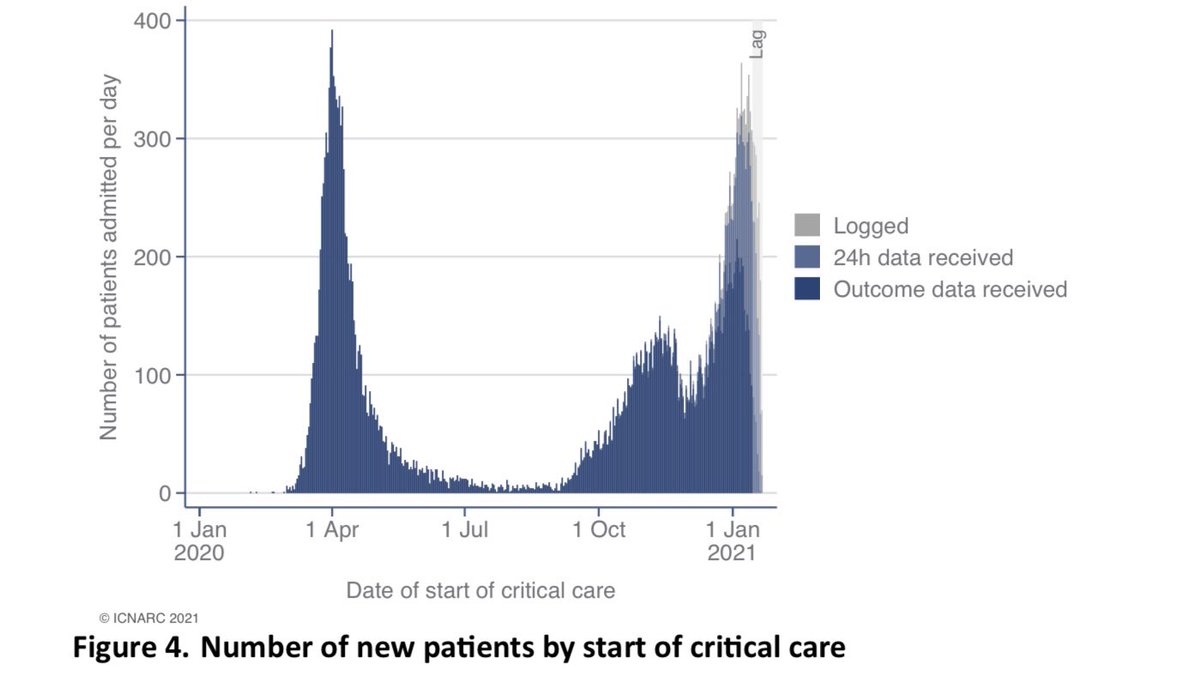
17,015 patients have been admitted to ICU so far in the second wave, significantly more than the 10,938 in the first wave.
Short thread, with full report linked below.
17,015 patients have been admitted to ICU so far in the second wave, significantly more than the 10,938 in the first wave.
Short thread, with full report linked below.
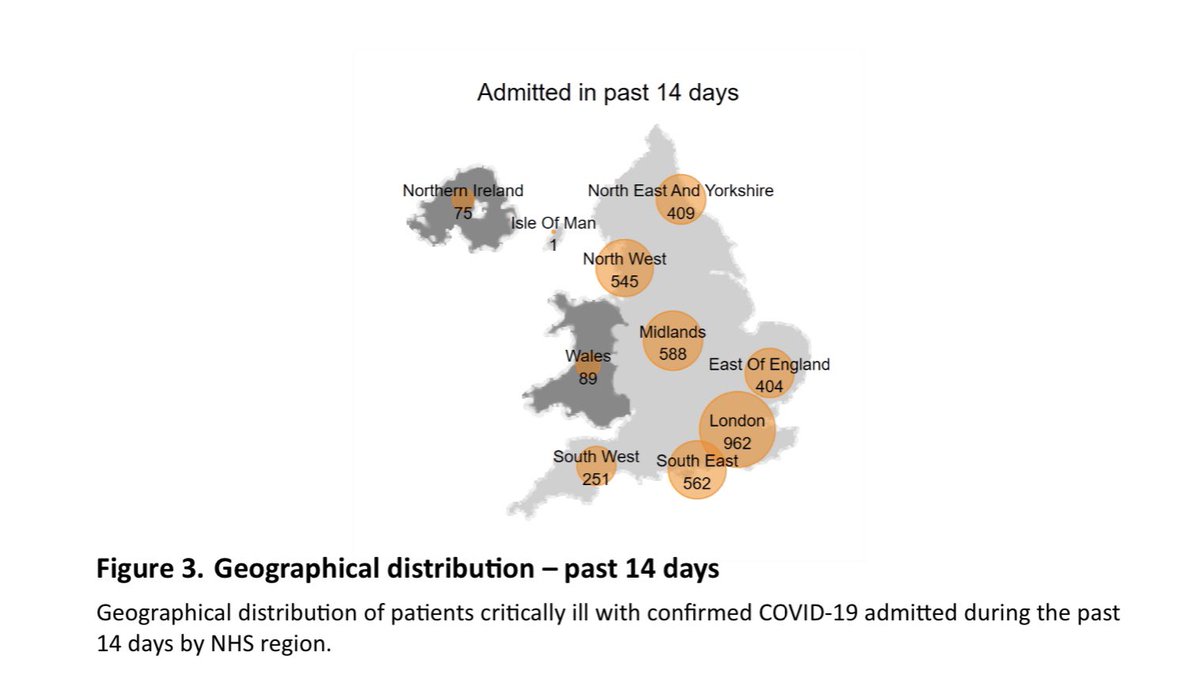
In the last two weeks, ICU admissions have been high in most parts of England, especially London and surrounding areas.
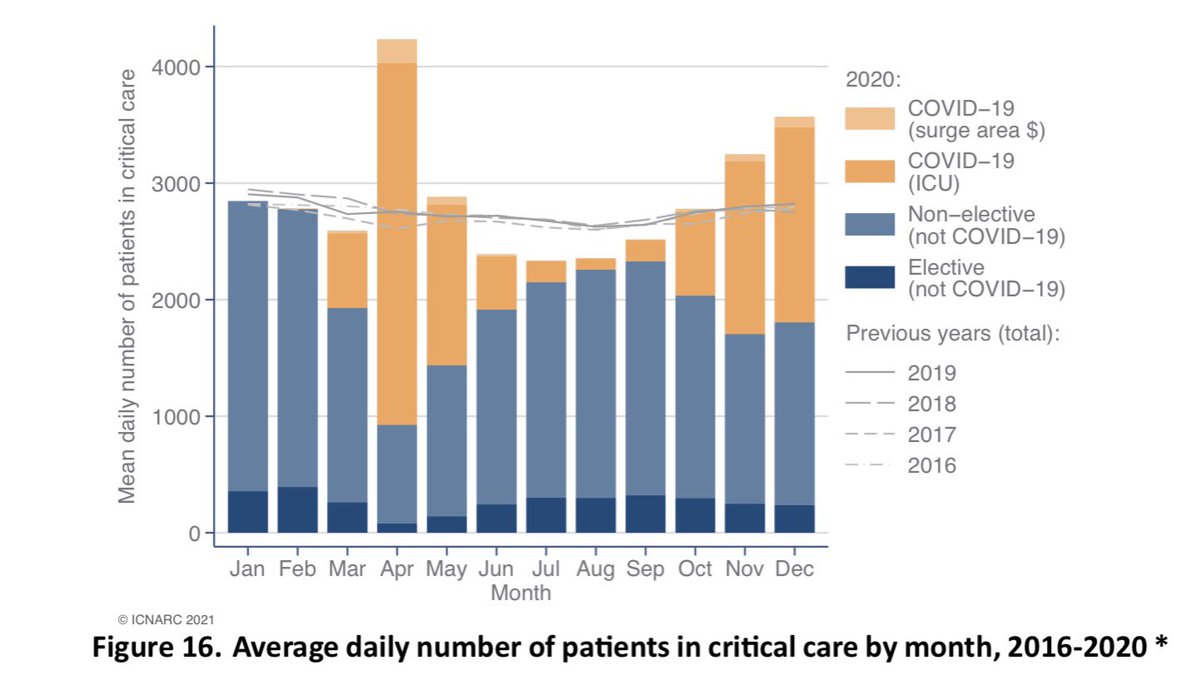
Figure 16 illustrates the average daily number of patients in ICU for any reason in each month for the last five years.
This clearly shows that there were far more patients than normal in April, November and December 2020
This clearly shows that there were far more patients than normal in April, November and December 2020
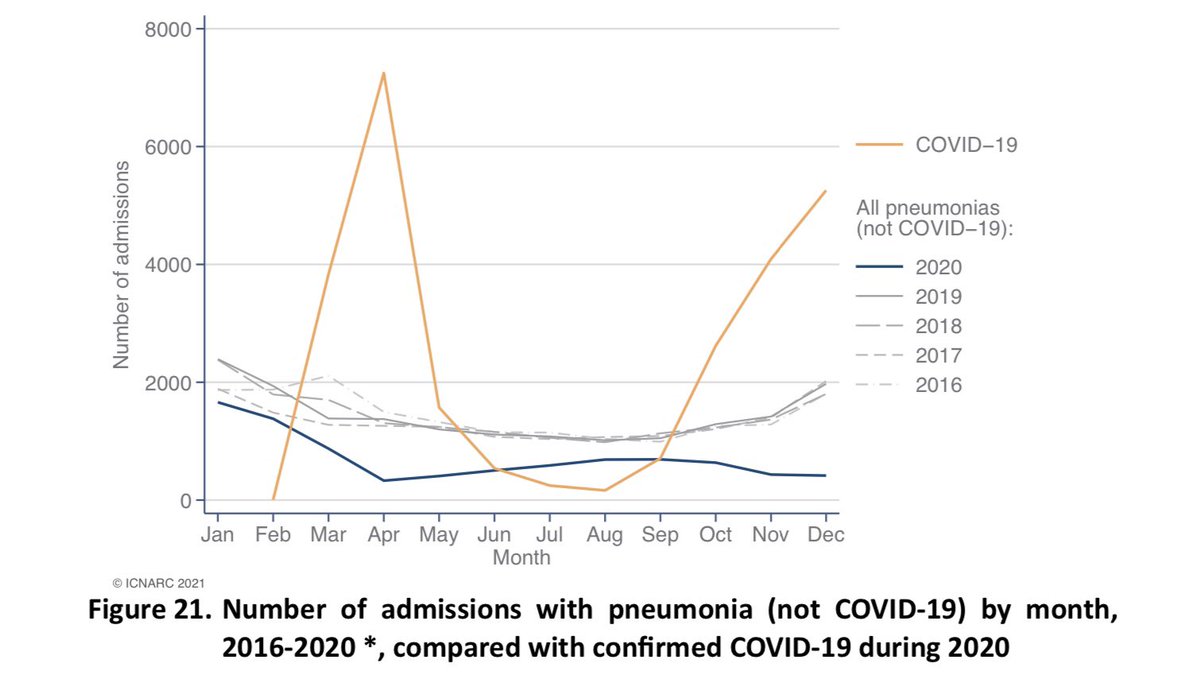
Figure 21 again compares the last five years, now looking only at COVID-19 and other admissions with pneumonia (for example caused by flu). This is very helpful for comparing the impact of COVID to recent flu seasons.
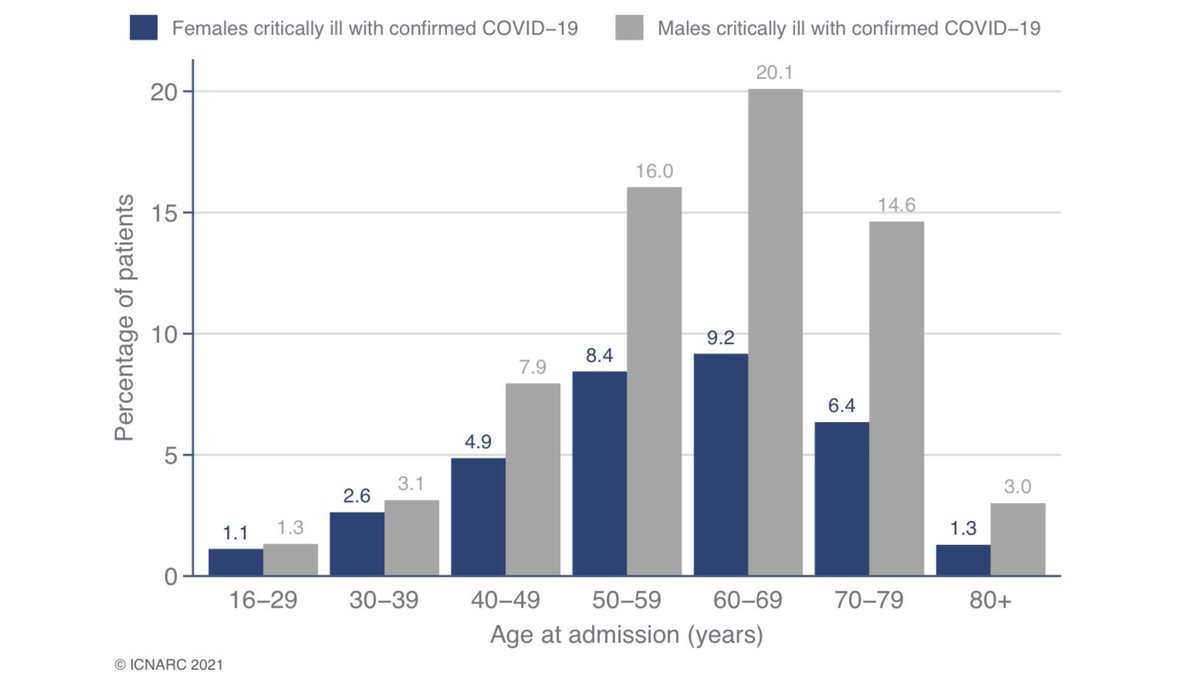
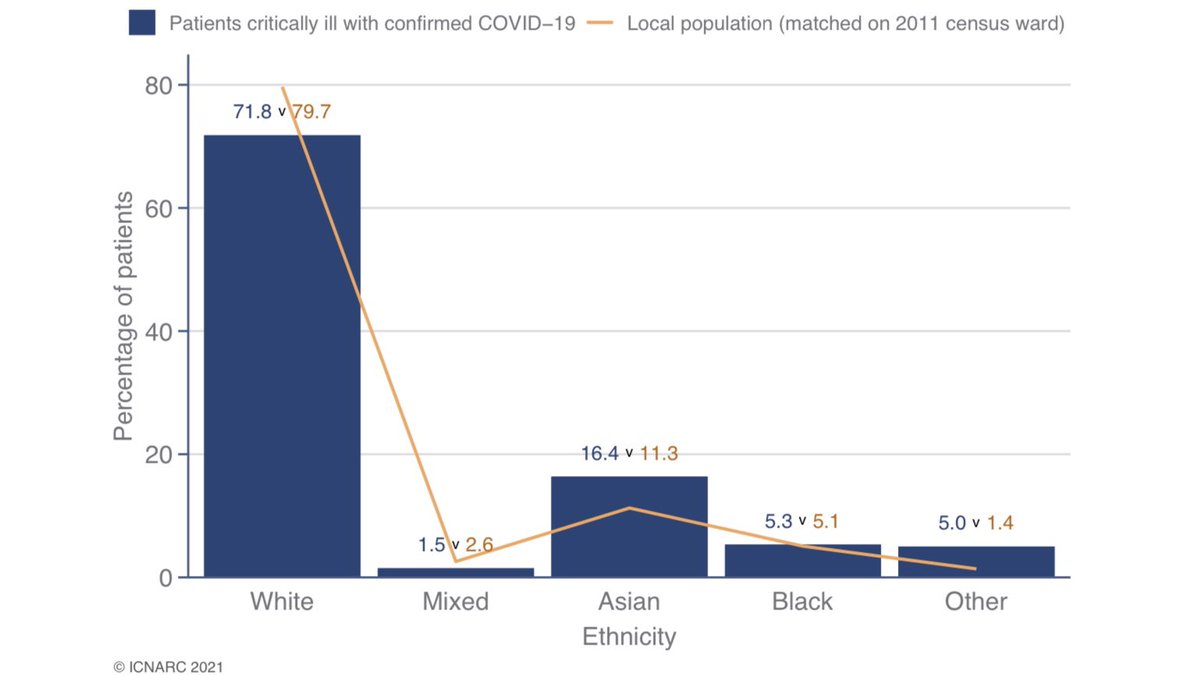
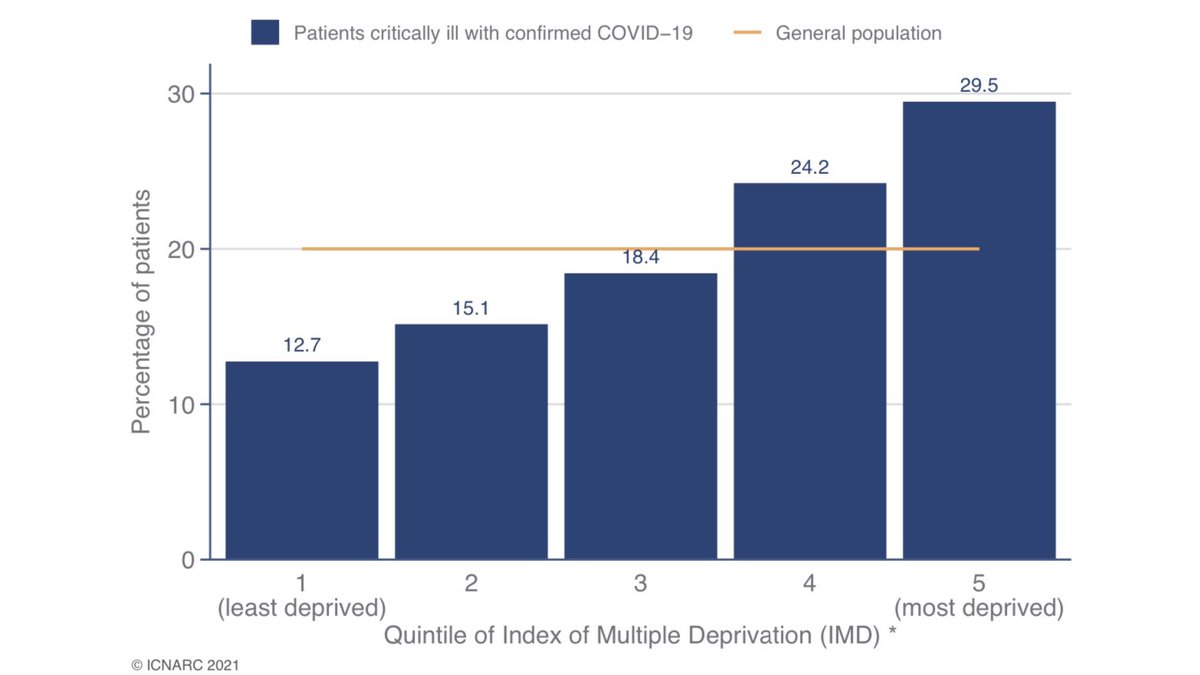
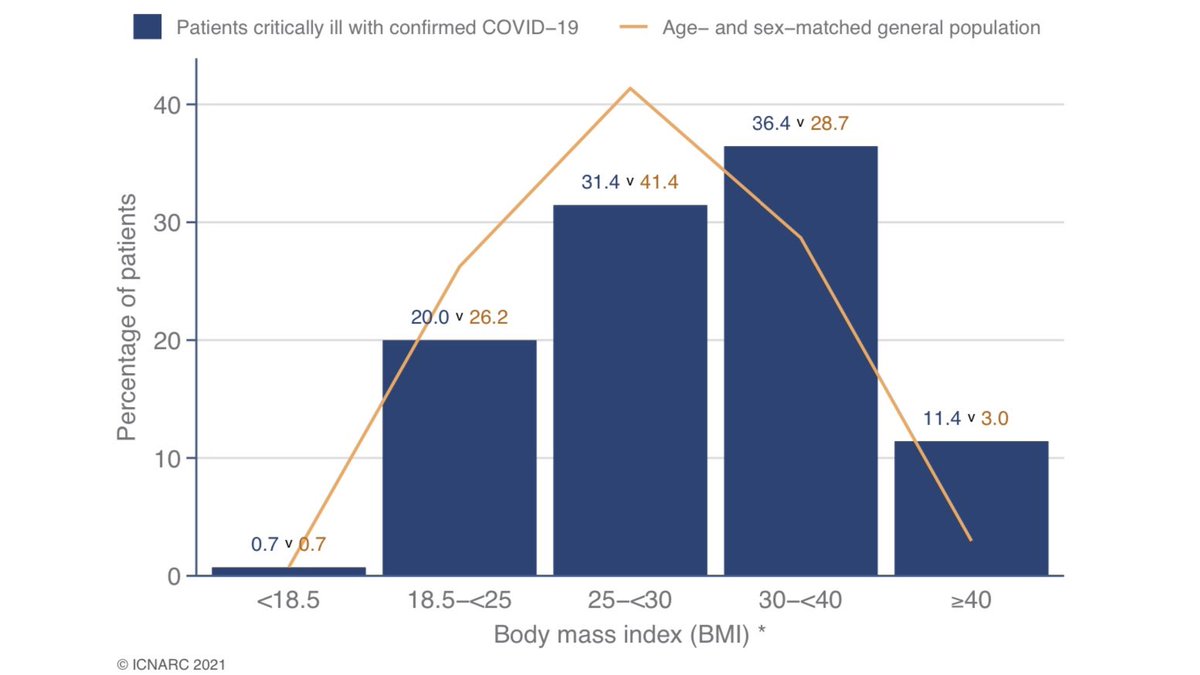
Table 1 and the subsequent charts allow us to examine demographic characteristics compared to what might be expected (orange lines).
Overrepresented groups include males (two thirds of ICU admissions), those of Asian ethnicity, more deprived groups and the obese (BMI>30).
Overrepresented groups include males (two thirds of ICU admissions), those of Asian ethnicity, more deprived groups and the obese (BMI>30).
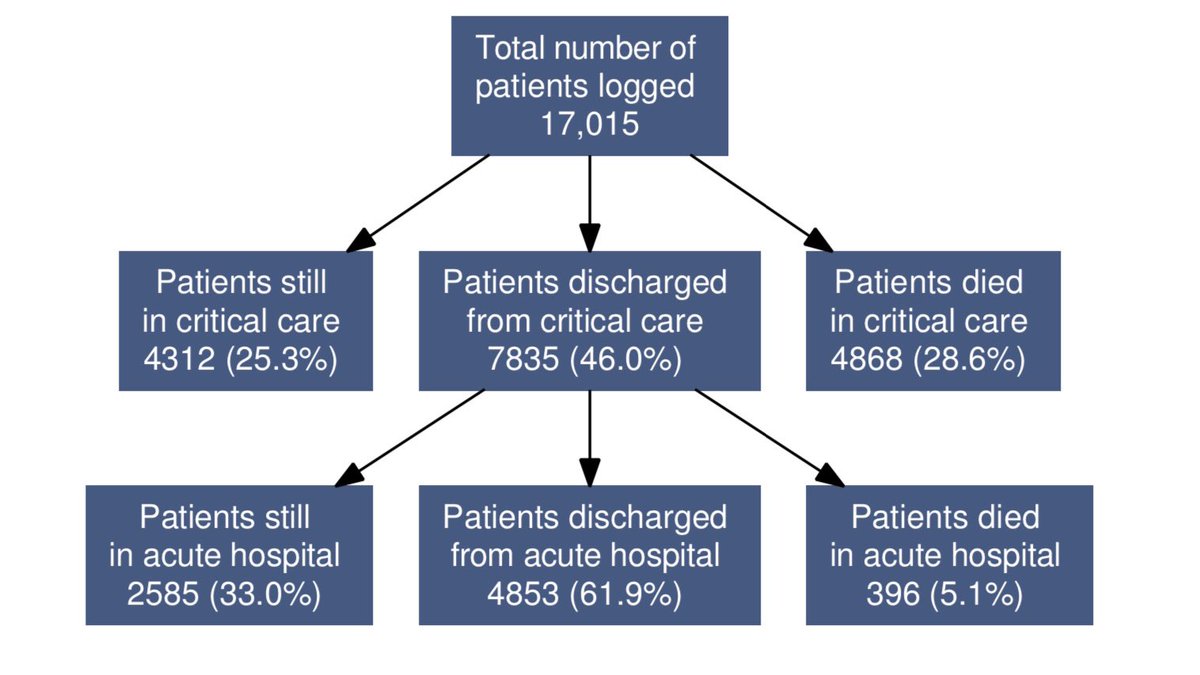
Of the 17,015 patients admitted to ICU in the second wave:
- 4,853 (29%) have been discharged from hospital
- 4,312 (25%) are still in critical care
- 2,585 (15%) are still in hospital (outside ICU)
- 5,264 (31%) have sadly died.
- 4,853 (29%) have been discharged from hospital
- 4,312 (25%) are still in critical care
- 2,585 (15%) are still in hospital (outside ICU)
- 5,264 (31%) have sadly died.
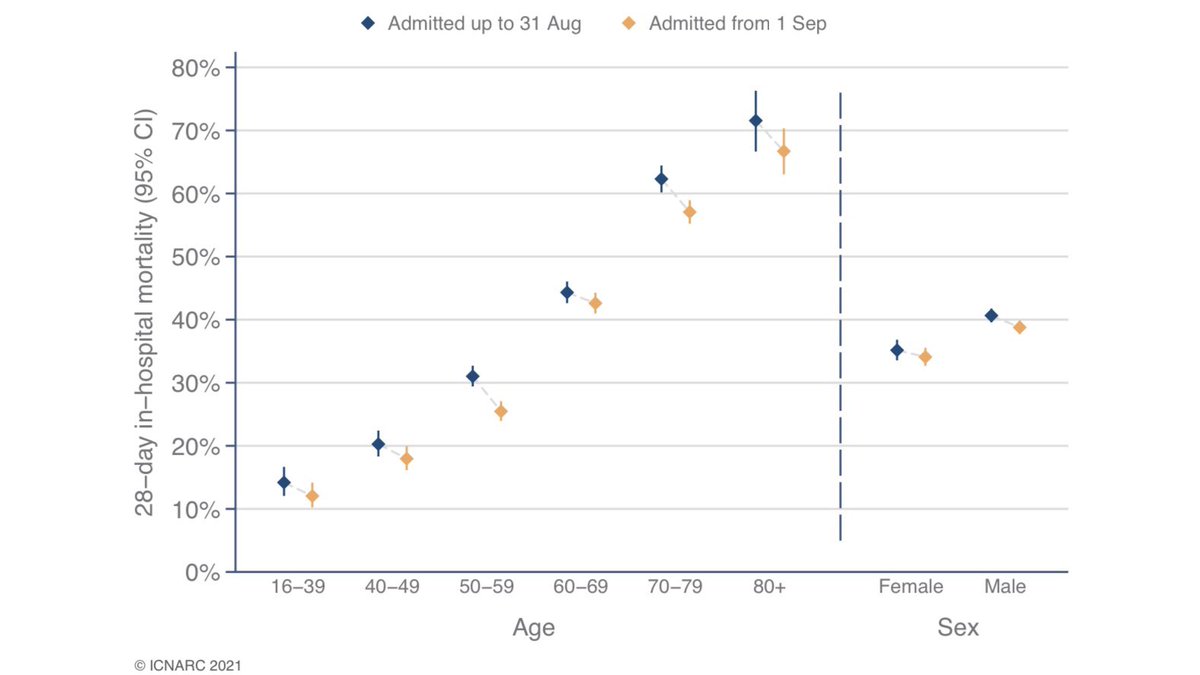
Within demographic groups, 28-day mortality has improved since the first wave. This improvement is nowhere near as significant as appeared to be the case early in the second wave though.
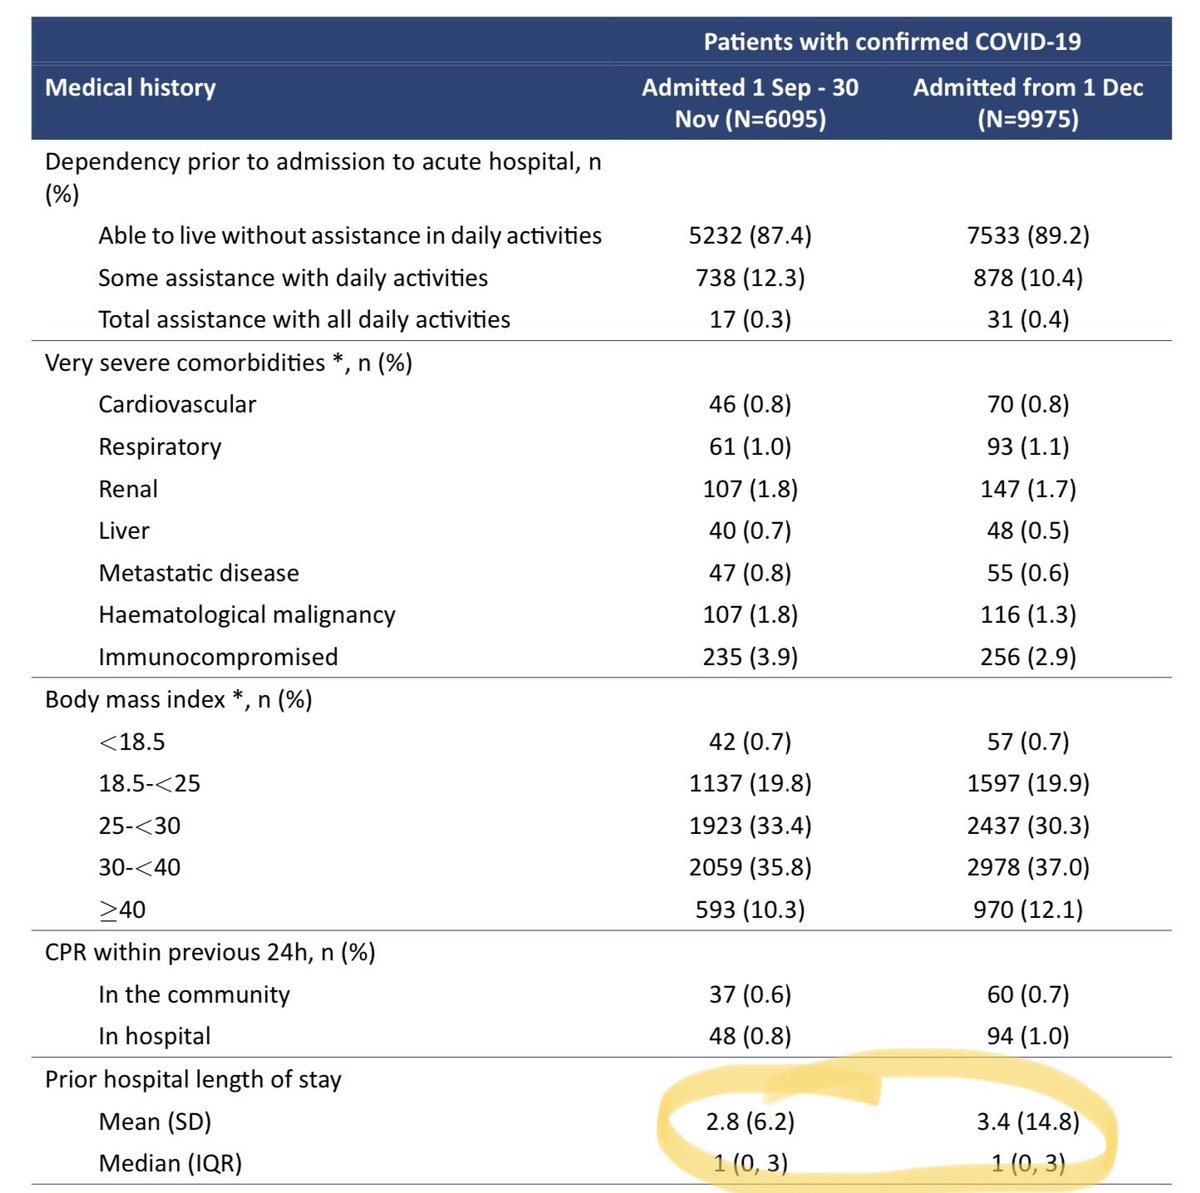
Interesting new analysis tries to study the impact of new variant by splitting patients pre/post 1 December (nationally and in regions where it was first identified).
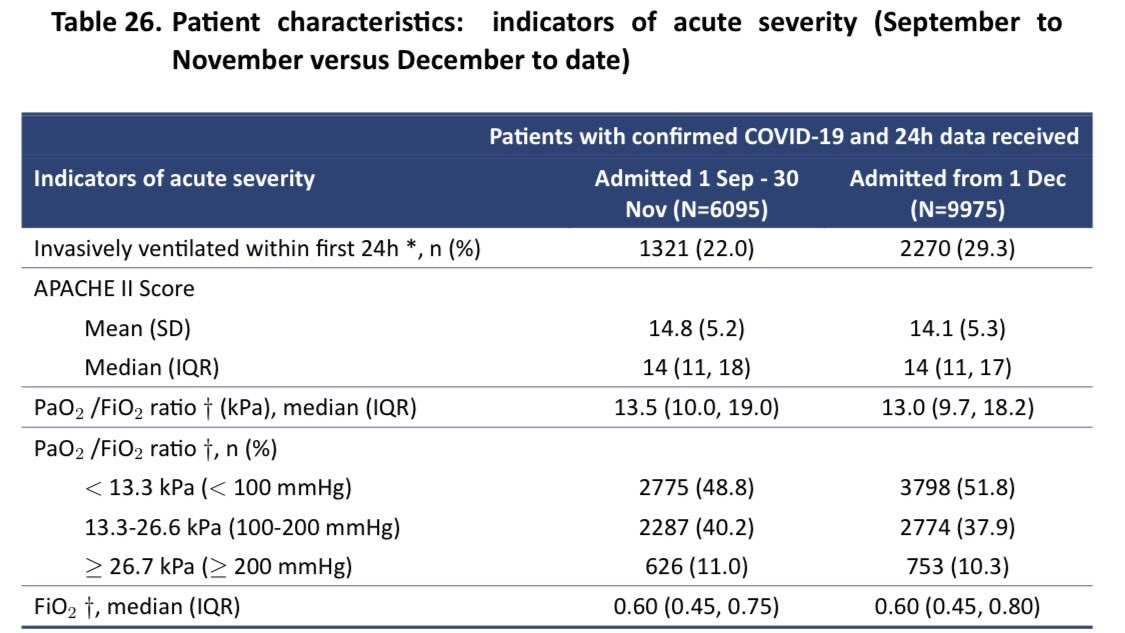
First thing that jumped out at me was the increase in the proportion requiring ventilation in first 24 hours.
First thing that jumped out at me was the increase in the proportion requiring ventilation in first 24 hours.
Does this indicate more severe illness from the new variant? That’s difficult to say. It’s not obvious to me from the other severity indicators.
Perhaps what we are seeing is a consequence of increased demand meaning longer delays on average before admission to ICU?
Perhaps what we are seeing is a consequence of increased demand meaning longer delays on average before admission to ICU?
Here is a link to full report which contains lots of extra information as well as the items I’ve highlighted.
Thanks as ever to @ICNARC for this timely and informative reports and to all those in critical care and across the NHS for all you are doing to save lives. https://twitter.com/icnarc/status/1352712396134109188
Thanks as ever to @ICNARC for this timely and informative reports and to all those in critical care and across the NHS for all you are doing to save lives. https://twitter.com/icnarc/status/1352712396134109188

 Read on Twitter