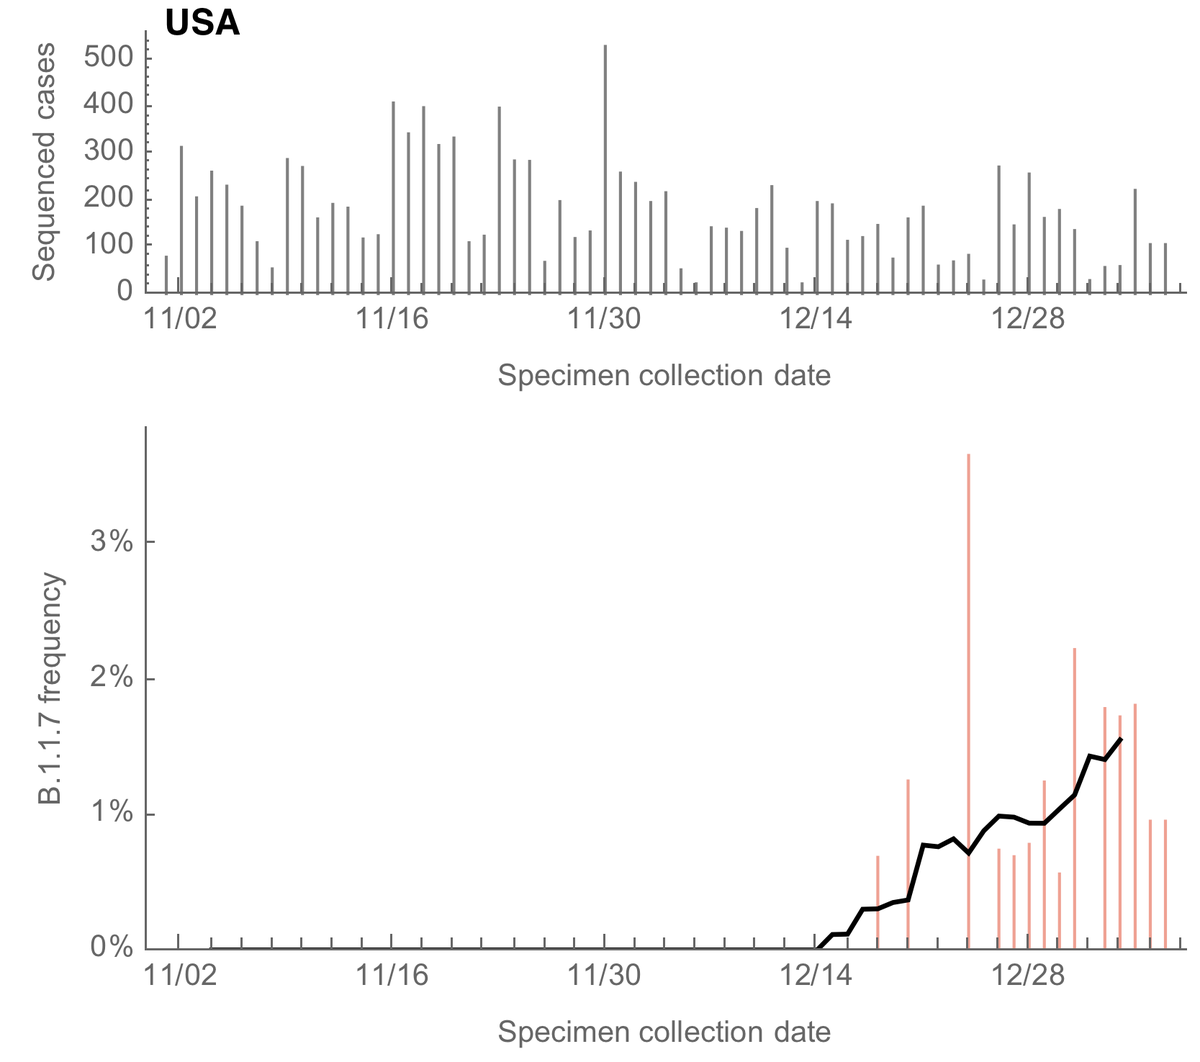
At this point, the countries with most genomic data to analyze spread of the variant virus belonging to https://cov-lineages.org B.1.1.7 lineage or @nextstrain clade 20I/501Y.V1 are the UK, Denmark and the USA. Here I compare growth rates of B.1.17 across these countries. 1/13
Working from @GISAID data, the UK has 18776 genomes, Denmark has 6089 genomes and the USA has 3093 genomes from specimens collected after Dec 15, 2020. Here, I'm looking at daily genomes with collection dates up to Jan 6 that were not pre-screened by "S dropout". 2/13
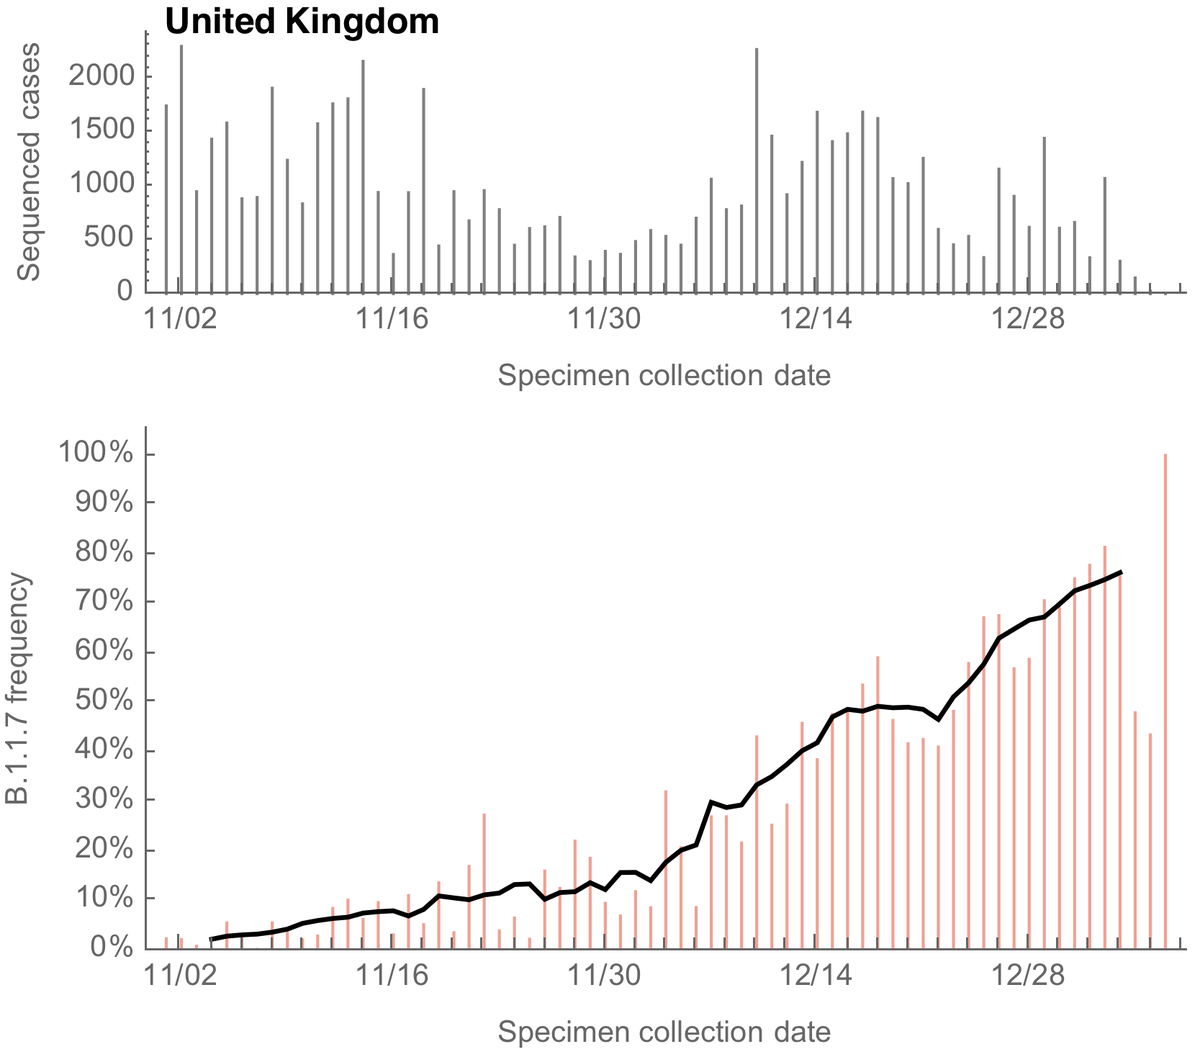
For the UK, we can see a steady increase in the frequency of sequenced variant viruses belonging to the B.1.1.7 lineage, reaching ~70% frequency at the end of December. Solid line is a 7 day sliding window average. 3/13
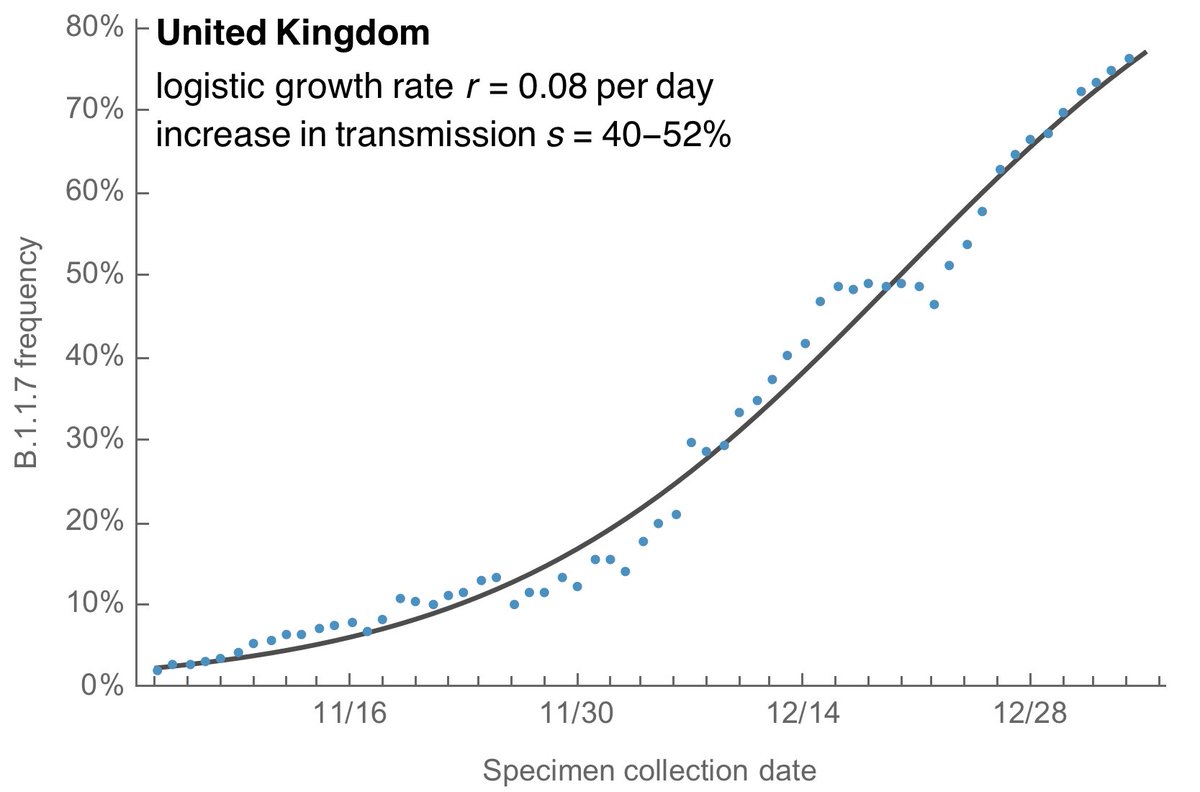
We can fit a logistic growth model to the frequency of B.1.1.7 in the UK data to estimate the rate of frequency increase through time. 4/13
And following @erikmvolz et al ( https://www.medrxiv.org/content/10.1101/2020.12.30.20249034v2) we can convert from a measured frequency growth rate to an estimate of increased transmissibility by assuming a particular generation time, which I take to be between 5 days and 6.5 days. 5/13
Doing so gives the following result where the observed saturation of variant frequency is well matched by the logistic growth model with an estimate of logistic growth rate of B.1.1.7 of 0.08 per day corresponding to an increase in transmission rate of 40-52%. 6/13
This result fits with more rigorous modeling studies by Vöhringer et al ( https://virological.org/t/lineage-specific-growth-of-sars-cov-2-b-1-1-7-during-the-english-national-lockdown/575) and @_nickdavies et al ( https://cmmid.github.io/topics/covid19/uk-novel-variant.html), and the 30-50% increase in transmission is supported by secondary attack rate estimates from @PHE_uk ( https://www.gov.uk/government/publications/investigation-of-novel-sars-cov-2-variant-variant-of-concern-20201201). 7/13
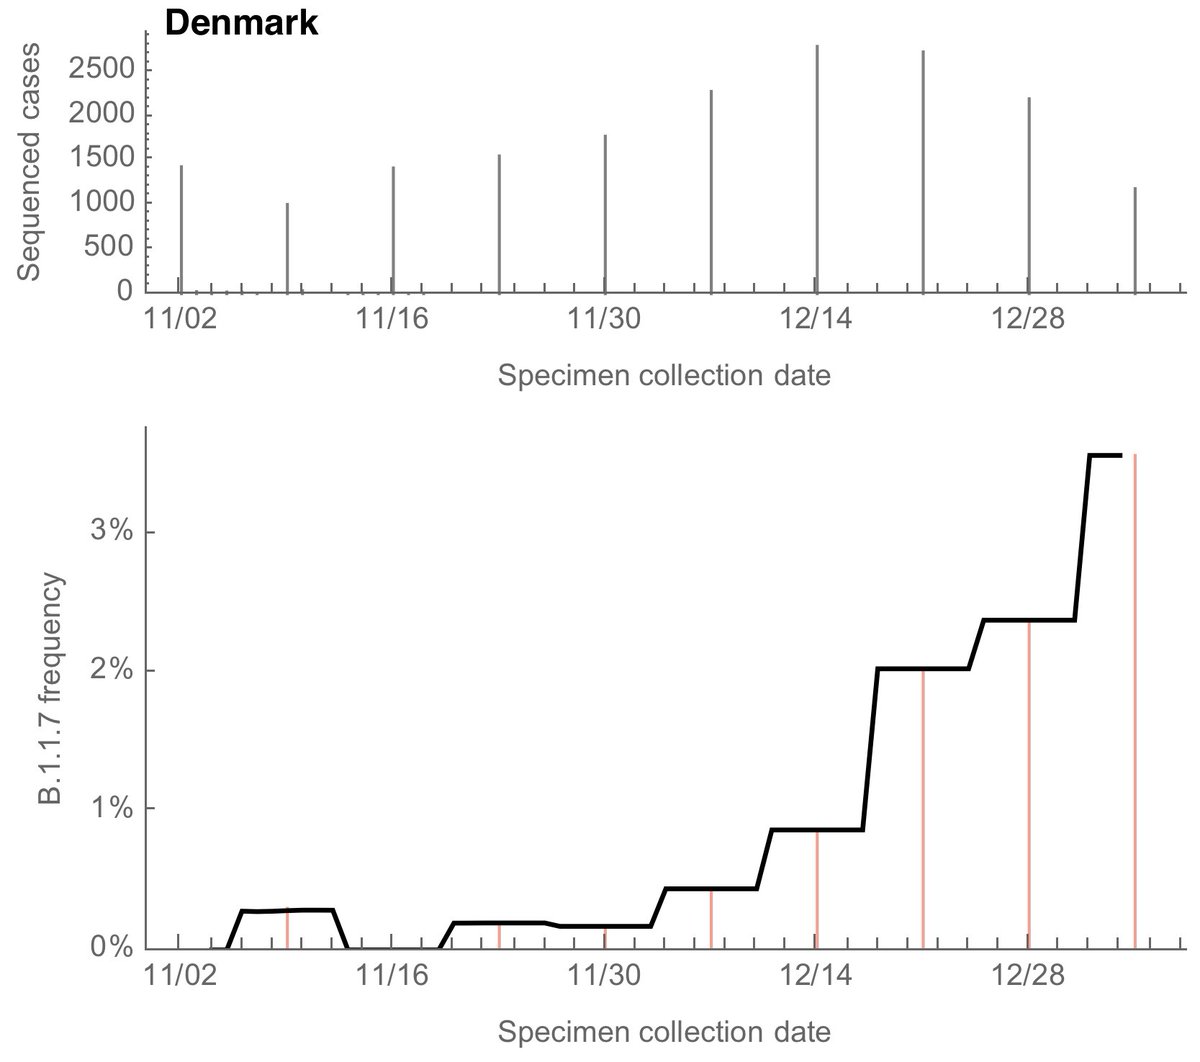
We can do a similar analysis of genomic data from Denmark where we see an increase in B.1.1.7 frequency to ~3% over the course of December. Sparser bars are due to Denmark releasing specimen collection dates by week rather than by day. 8/13
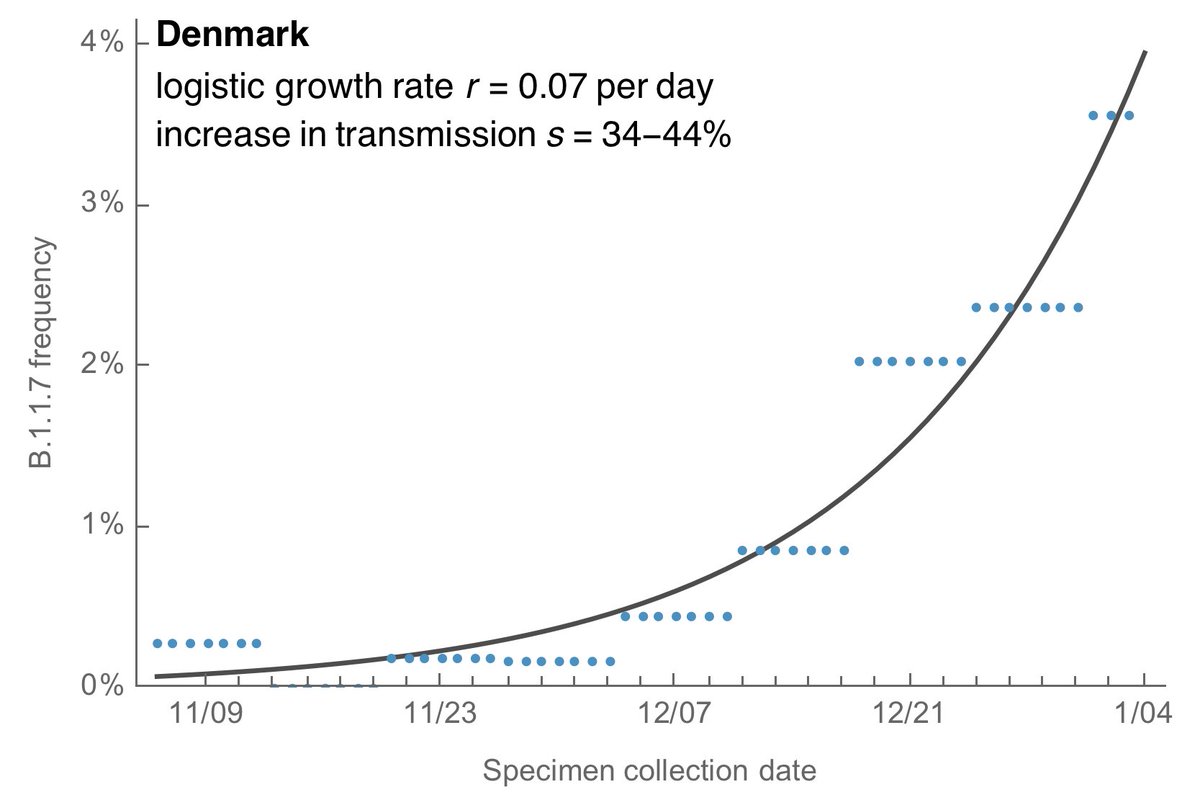
Using the same logistic growth model, we get a logistic growth rate of B.1.1.7 of 0.07 per day in Denmark corresponding to an increase in transmission rate of 34-44%. 9/13
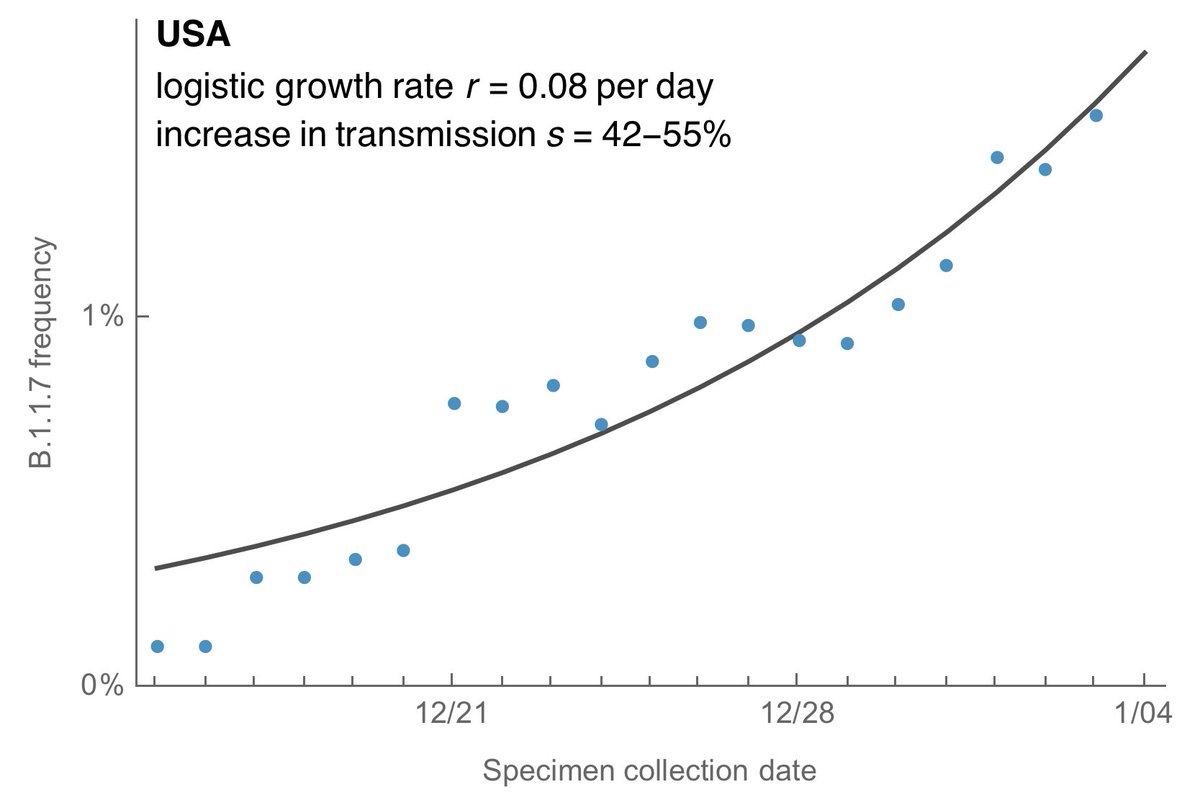
At the end of December the US frequency of B.1.1.7 was approximately ~1%. Recent samples used in this estimate are largely from New York, California, Wisconsin, Wyoming, Maryland and New Mexico. 10/13
The logistic growth model gives a logistic growth rate of B.1.1.7 of 0.08 per day in the US which corresponds to an increase in transmission rate of 42-55% although this estimate is noisy at this point. 11/13
Similar rates of frequency growth of lineage B.1.1.7 in different geographic contexts support biological increase in transmission rate of the 501Y.V1 variant. 12/13
Near real-time tracking of the spread of B.1.1.7 is possible due to efforts of @covidgenomicsuk in the UK, https://www.covid19genomics.dk in Denmark and @HealthNYGov, @CedarsSinai, @HealthNYGov, @CedarsSinai, @tcflab, @dho_lab, @health_wyoming, @NMDOH among others in the US. 13/13

 Read on Twitter