This is an interesting read by @cjsnowdon but not sure his examples necessarily support his case.
Take Ireland: Level 5 lockdown restrictions (pubs, cafes hairdressers shut) started on 24 Dec. The vertical rise in cases started 8 days after that on 2 Jan & continued to 8 Jan. https://twitter.com/cjsnowdon/status/1350359754909093889
Take Ireland: Level 5 lockdown restrictions (pubs, cafes hairdressers shut) started on 24 Dec. The vertical rise in cases started 8 days after that on 2 Jan & continued to 8 Jan. https://twitter.com/cjsnowdon/status/1350359754909093889
More restrictions were added up until 31st Dec & cases started dropping from the 9th. But you could just as easily claim the 24th Dec restrictions caused the vertical rise on the 2nd as to claim the extra restrictions caused the drop on the 9th.
I don't think Ireland reports by specimen date & also there were reporting lags. So probably pretty hard to be certain about any cause & effect, but it's not exactly a poster case for lockdown restrictions.
Also, the England November lockdown is not a great advert for lockdowns achieving their aim of relieving pressure on hospitals.
Admissions started decreasing from 11 Nov, far too earlier for the 5th Nov lockdown to be the cause ...
Admissions started decreasing from 11 Nov, far too earlier for the 5th Nov lockdown to be the cause ...
Most devastatingly, although admissions did decrease for a while, they actually started increasing again from the end of Nov, i.e. whilst the lockdown was still in place.
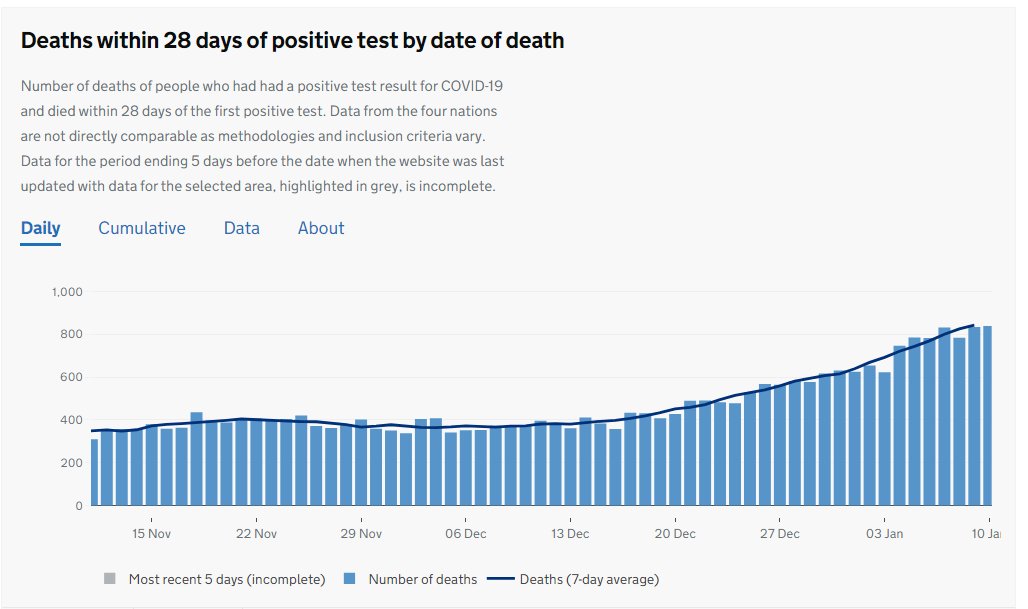
This is consistent with the deaths data. There was a (small) decrease from about the 22 Nov too early for 5th Nov lockdown to be the cause. Then quite a fast increase from about 14 Dec, clearly implying an increase in infections during the lockdown.
As always, we can't completely rule out that lockdowns have some marginal effect on things - possibly changing the timing of cases or perhaps causing a slightly faster decrease or slower increase. But even that is not clear either from the data or from the academic studies.

 Read on Twitter


