We look at daily predictions for 13 battleground states over a seven month period, comparing @TheEconomist model and @PredictIt
Performance differences over the entire period are negligible but the market does better at the start, model better at the end, based on Brier scores:
If one just takes a simple average of model and market, this hybrid forecast does better overall, averaging across dates and states, and beats both component forecasts on 87 of 216 days, including the last 26:
This suggest the value of combining markets and models, and the paper proposes a way to do this via a trading bot that internalized the model; basic idea was described in this @ci_acm keynote:
Here's a link to the paper, comments welcome: https://papers.ssrn.com/sol3/papers.cfm?abstract_id=3767544
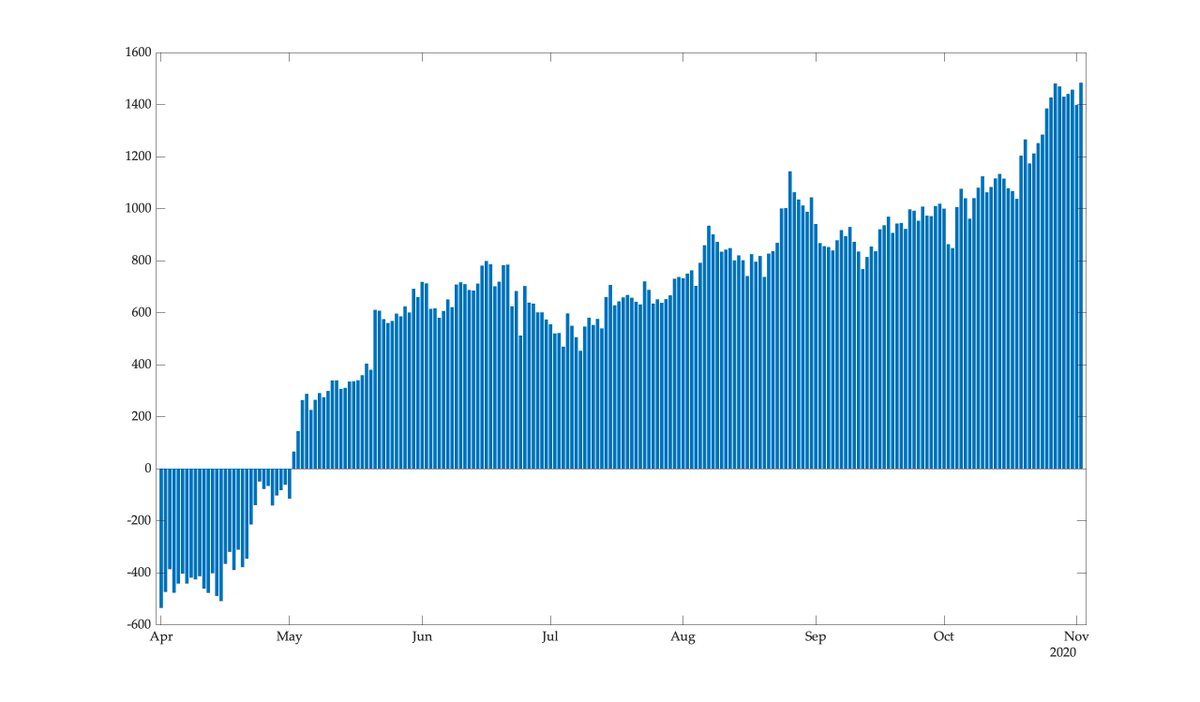
And here's trading volume for the 13 battleground states, you see a massive inflow of money and volume is a thousand times as great at the end of the period when compared to the start (log scale):
Some of this inflow was from conspiracy minded folks who kept betting after the election, certain that the results would be overturned; this likely hurt market performance towards the end of the period
So any model that tries to incorporate prediction market prices should pay attention to volume
How can the hybrid forecasts beat both components when averaging across all states and dates, even though it cannot beat both components for any given state-date pair? Because model and market make different kinds of errors in different states
Model is confident and wrong in FL and NC for example, market is excessively uncertain in NH and MN; this figure shows average daily Briers for entire period by state:
Here's link (again) to paper, this is preliminary, comments welcome: https://papers.ssrn.com/sol3/papers.cfm?abstract_id=3767544
One word of caution when looking at performance comparisons (Briers, calibrations); although we have over 2800 predictions for each method there are only 13 referenced events, one flip and measured performance could change a lot
The point of the paper is not to provide a meaningful horse race between methods but to show value of hybridization and propose market design for integration
Just updated the paper with a more general model and a profitability test, roughly along lines suggested by @jipkin https://papers.ssrn.com/sol3/papers.cfm?abstract_id=3767544
Here's how the model would have traded in the Wisconsin market (with a $1000 budget and log utility):
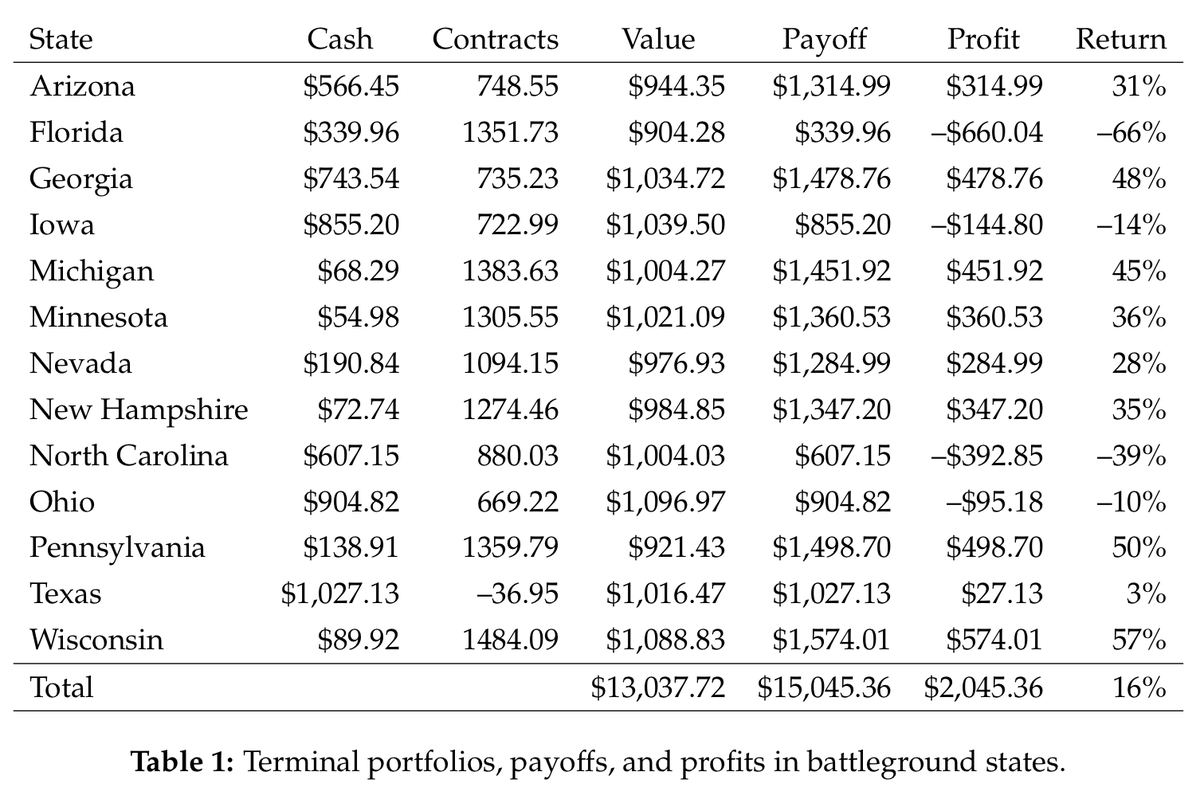
And here are model trading histories for the other 12 states, the bot is often short DEM but at the end this is only true in Texas:

 Read on Twitter


