A short thread to summarise the latest weekly intensive care report from @ICNARC.
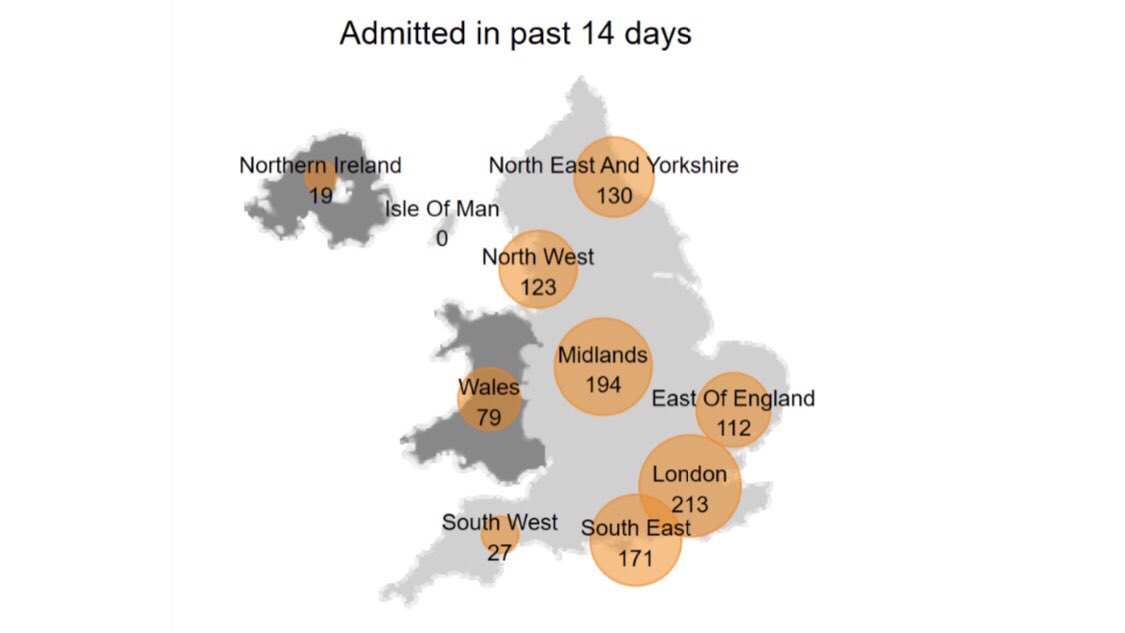
The report covers 7,677 second wave patients admitted by 17 December.
It is likely we’ll see more admissions in the second wave than the first. We’re already 70% of the way to 1st wave total. 1/6
The report covers 7,677 second wave patients admitted by 17 December.
It is likely we’ll see more admissions in the second wave than the first. We’re already 70% of the way to 1st wave total. 1/6
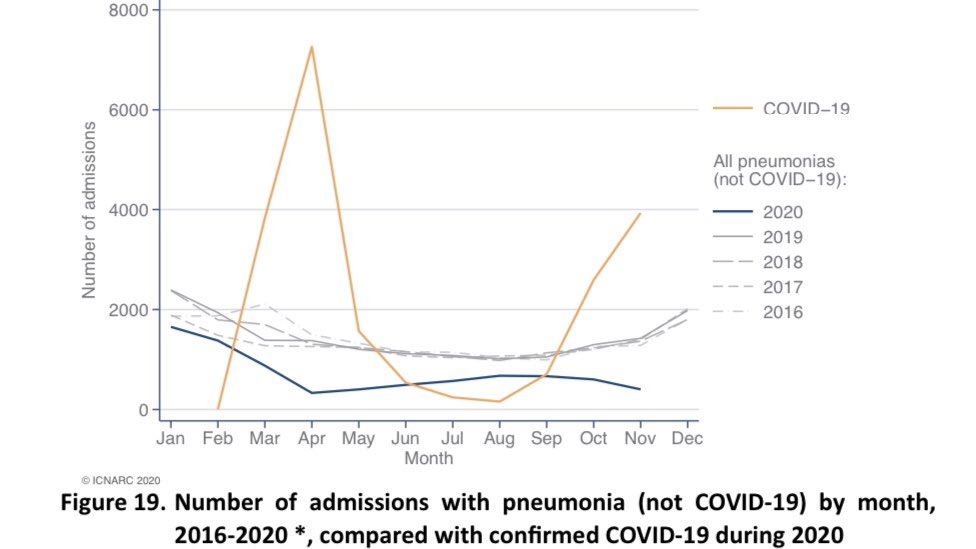
The grey lines on Figure 19 show ALL pneumonia admissions in the last four years. We can see that non-COVID admissions (blue) are lower than normal, but COVID admissions (orange) are much higher than the usual total. 2/6
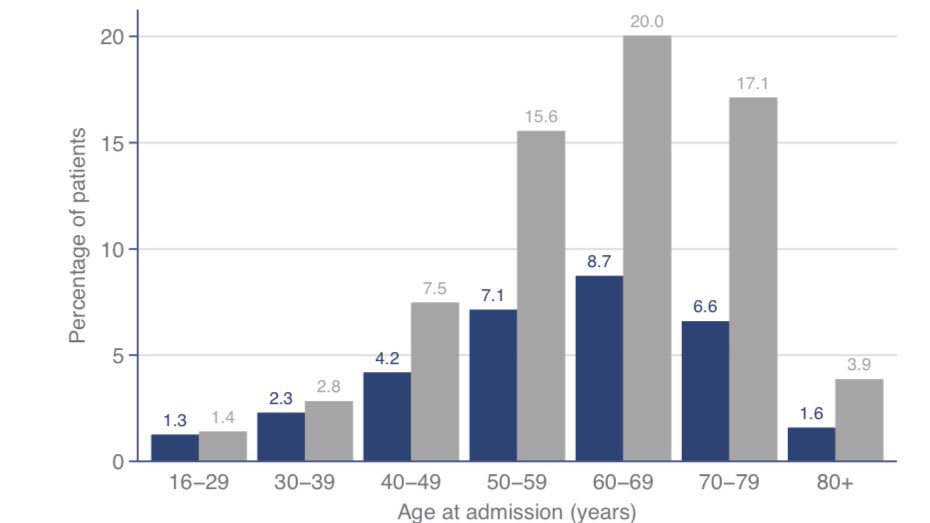
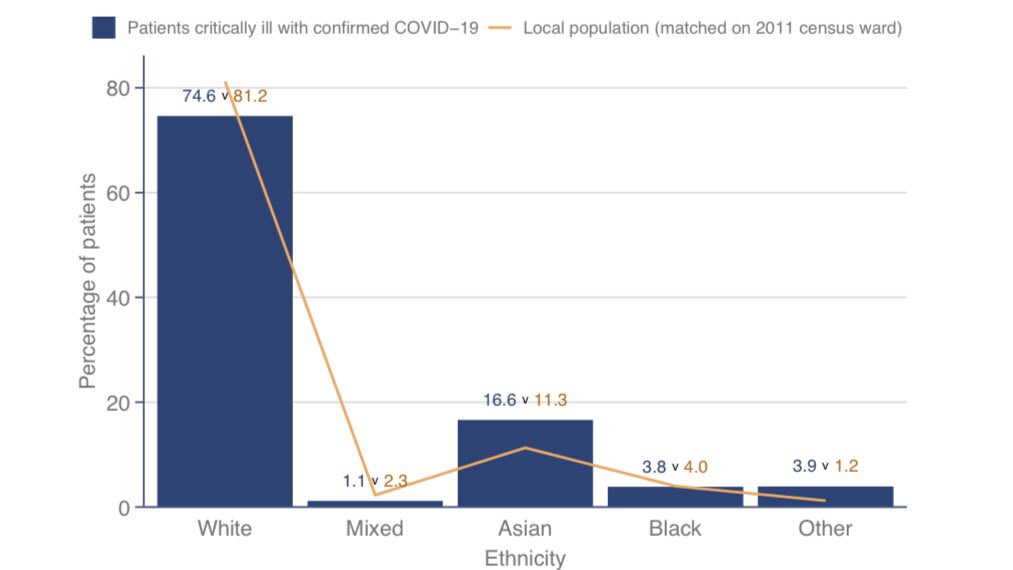
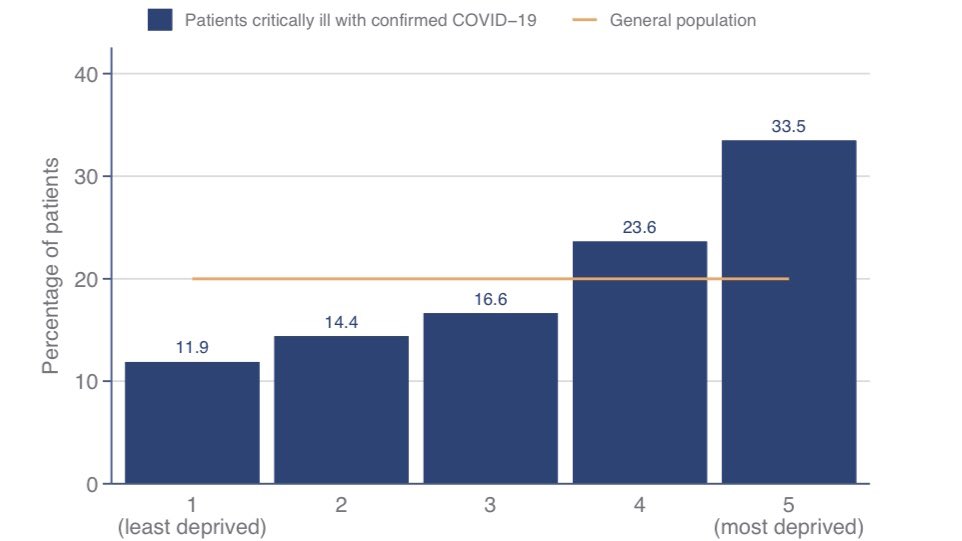
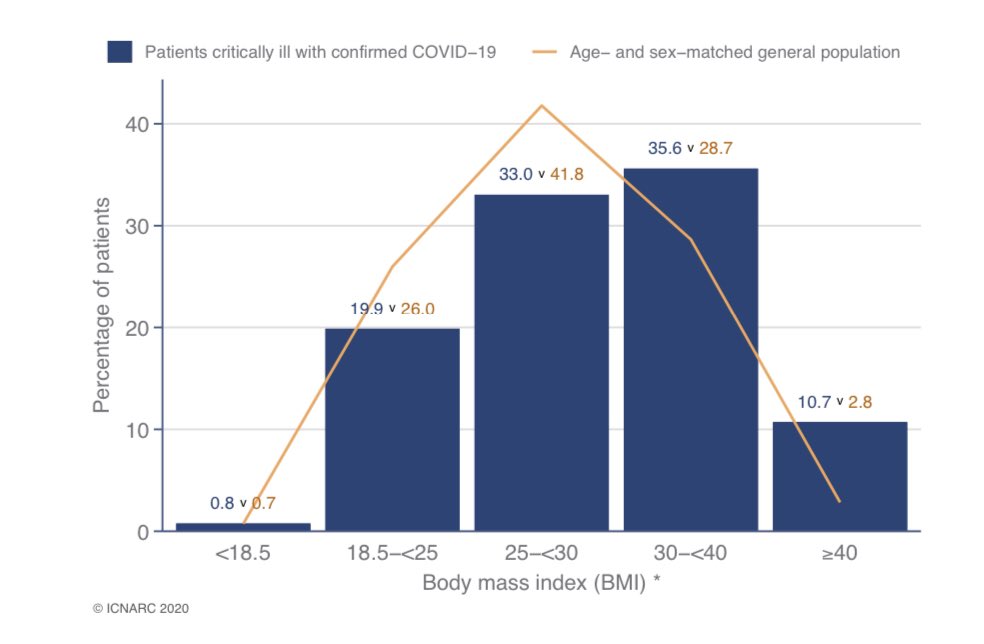
Table 1 and the subsequent charts allow us to examine demographic characteristics compared to what might be expected based on the local population.
Overrepresented groups include males (7 out of 10 ICU admissions), Asians, the deprived and the obese (BMI>30). 3/6
Overrepresented groups include males (7 out of 10 ICU admissions), Asians, the deprived and the obese (BMI>30). 3/6
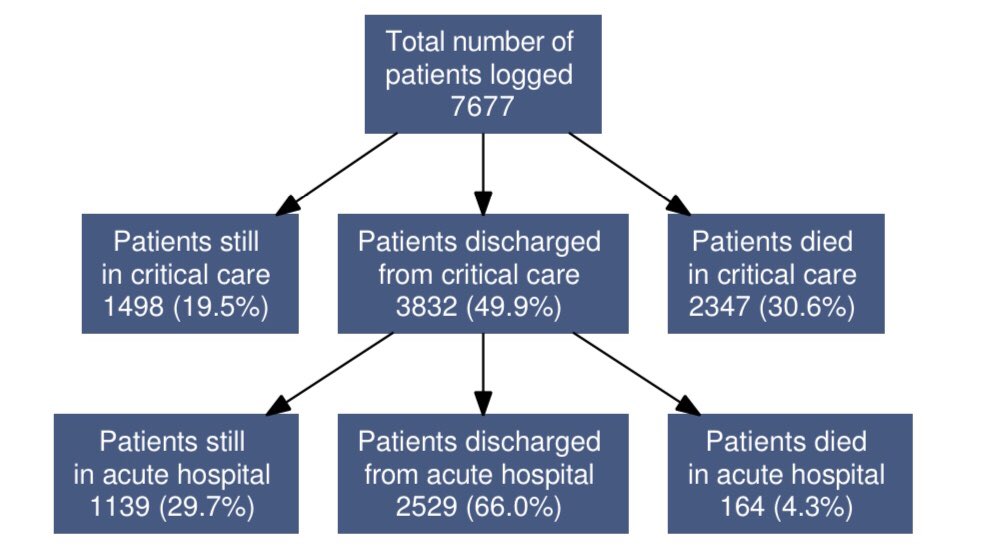
Outcomes overall no longer look better than the first wave.
Of the 7,677 patients admitted;
- one third have been discharged from hospital
- one third are still in hospital (either ICU or elsewhere)
- one third have died
4/6
Of the 7,677 patients admitted;
- one third have been discharged from hospital
- one third are still in hospital (either ICU or elsewhere)
- one third have died
4/6
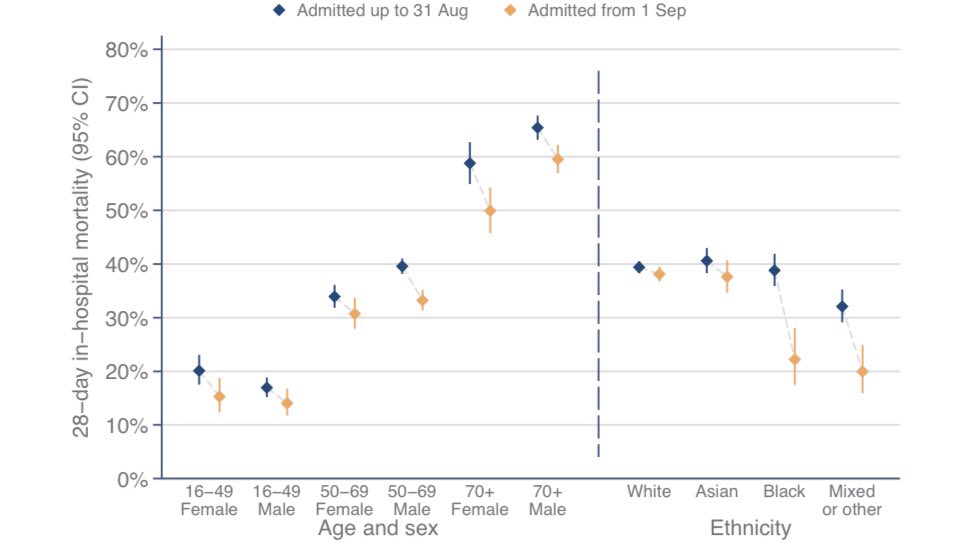
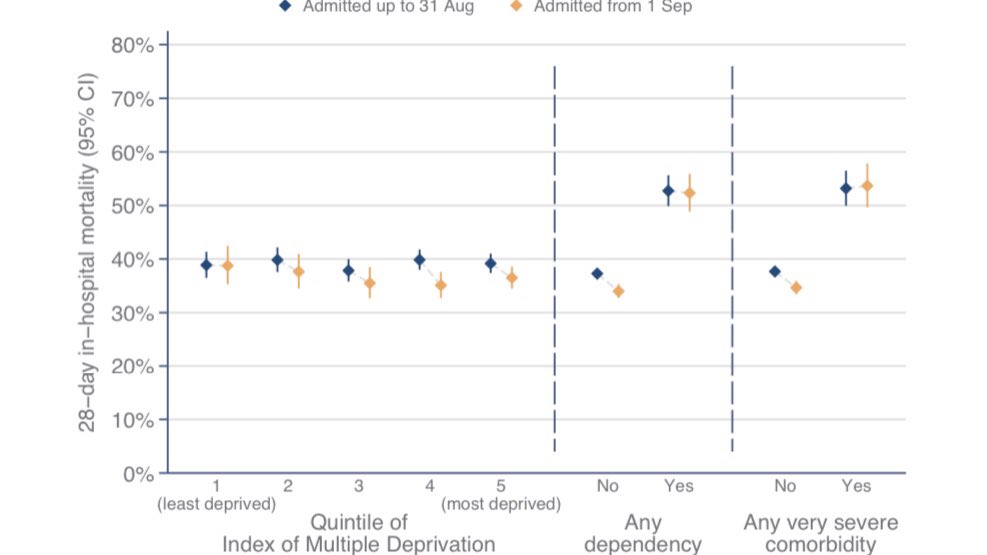
The mortality picture reflects case mix (for example, second wave patients are a bit older on average) as 28-day mortality is improved within each demographic group (though not all of the improvements are statistically significant). 5/6
Here is a link to full report which contains lots of extra information as well as the items I’ve highlighted. In particular more breakdowns by medical characteristics (I’ve focused more on the demographics).
The best Christmas present we can give ICU staff is staying away. 6/6 https://twitter.com/icnarc/status/1340004746925584384
The best Christmas present we can give ICU staff is staying away. 6/6 https://twitter.com/icnarc/status/1340004746925584384

 Read on Twitter