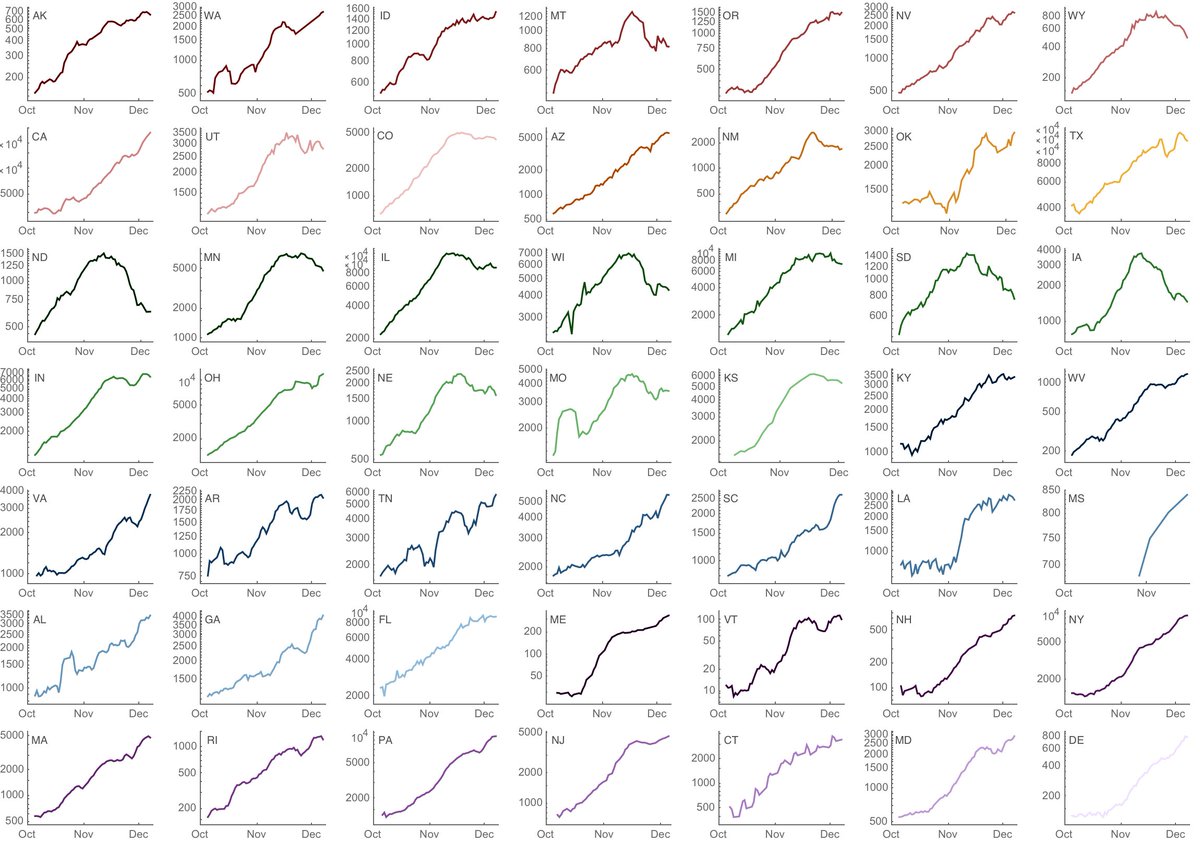
Although the US is continuing to hit records for daily #COVID19 cases reported, the rate of exponential growth has slowed. Mortality is still catching up to increased case loads and I expect daily deaths reported to further increase. 1/8 https://twitter.com/COVID19Tracking/status/1337556246120042496
This plot summarizes the overall picture. Bubble size is proportional to daily cases per capita from @COVID19Tracking and bubble color shows Rt from https://rt.live . Timepoints are shown up to two weeks ago due to delay in reliable estimates of Rt. 2/8
The Midwest and Mountain West had rapid growth during October resulting in large epidemics in November, but they're now starting to plateau or decline in incidence. Although current incidence is lower, the epidemic is still growing in much of the East Coast. 3/8
These trends can be seen in time series of state-level case counts. Plotting these on a log scale highlights exponential growth as straight lines. Some states have begun to decline (ND, WI), some have plateaued (CO, MI) and others are still growing (CA, AZ, NY). 4/8
Overall, exponential growth of cases in the US has slowed considerably. However, going forwards it remains to be seen whether there will be significant reduction in circulation instead of a plateau. 5/8
The lookahead projection of converting 1.7% of reported cases to reported deaths 22-days later has remained largely predictive, although it's been slightly over-predicting deaths this past week. 7/8
Still, I expect the 7-day average of daily reported deaths to continue to climb in the next 3 weeks to reflect case loads that are higher today than they were ~22 days ago. 8/8

 Read on Twitter


