The latest @ICNARC intensive care weekly report has been published. A short thread to summarise, including a link to the full report.
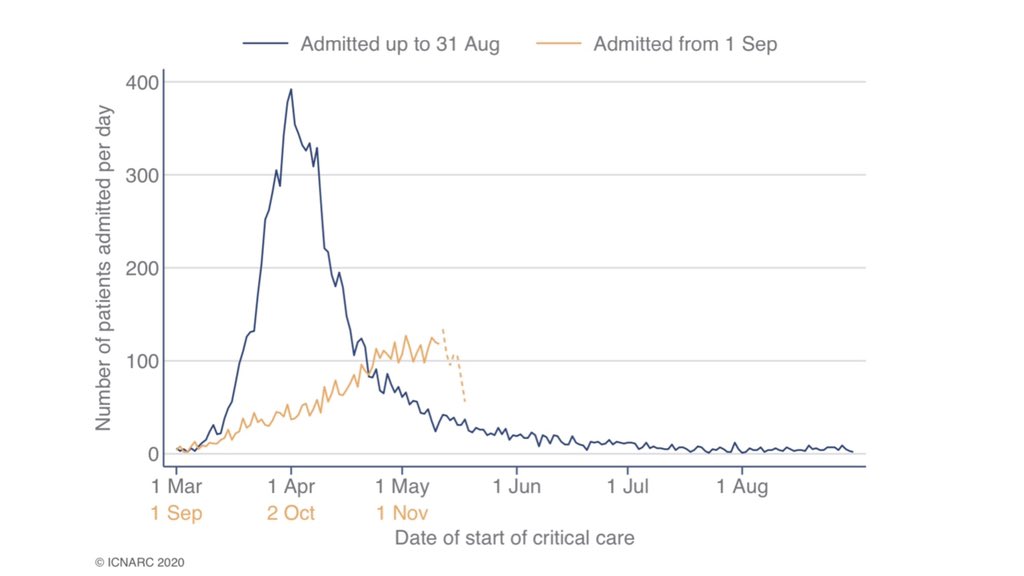
The report covers critical care admissions to 20 November and compares the second wave (1 Sep onwards) to the first. 1/9
The report covers critical care admissions to 20 November and compares the second wave (1 Sep onwards) to the first. 1/9
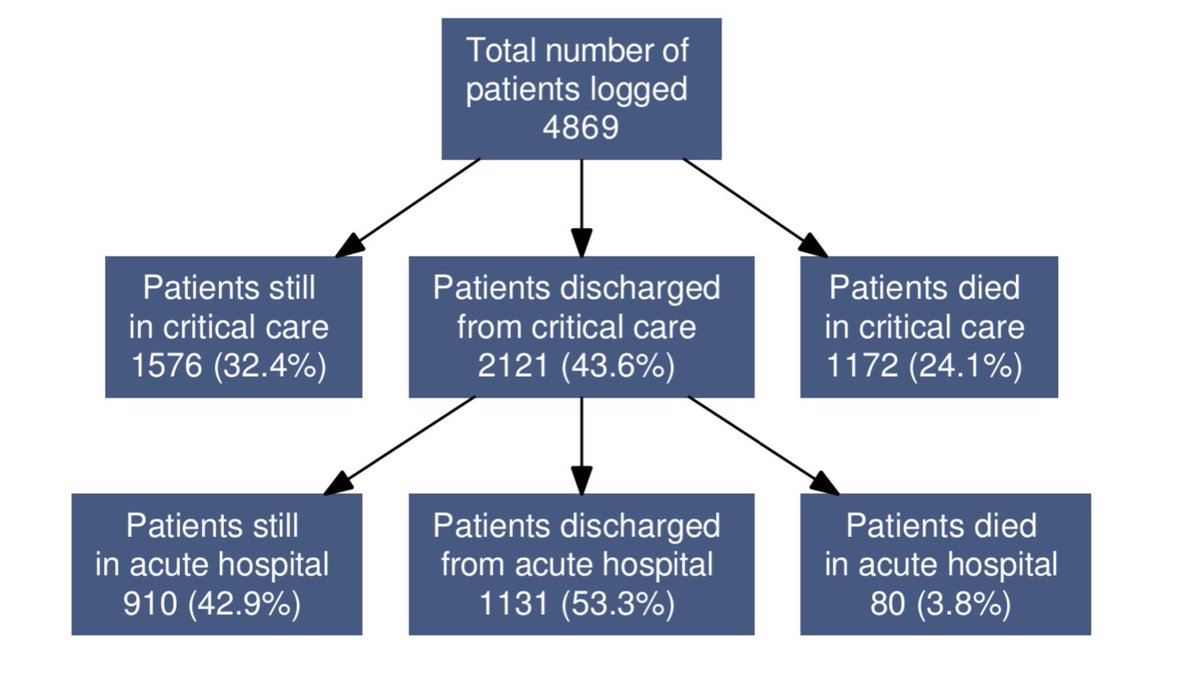
The report now covers 4,869 patients from 1 September. Critical care outcomes are reported for 3,293 of these patients.
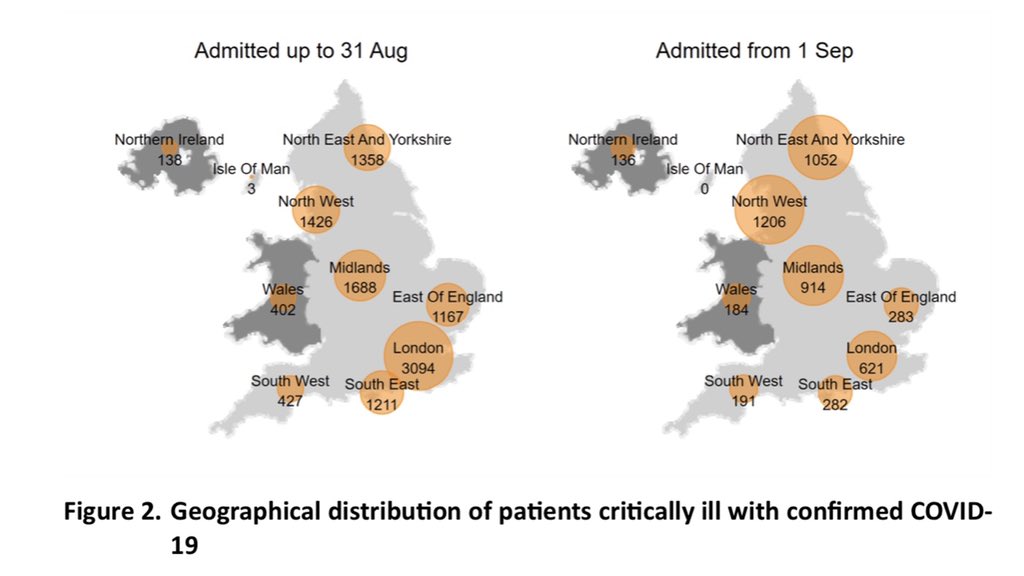
Most second wave admissions in the North of England and the Midlands. Interesting to compare and contrast locations with first wave. 2/9
Most second wave admissions in the North of England and the Midlands. Interesting to compare and contrast locations with first wave. 2/9
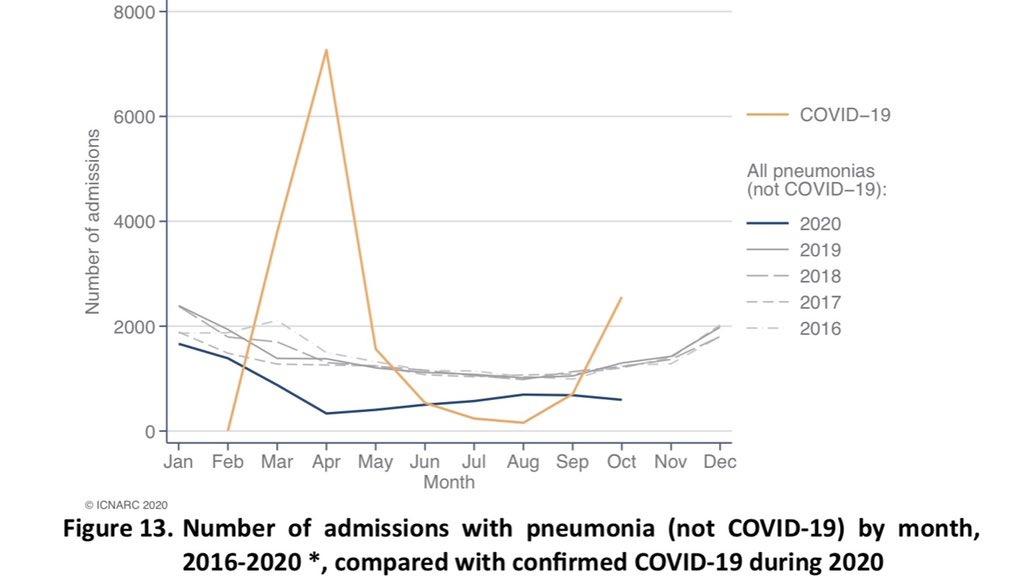
Figure 13 compare all pneumonia admissions in recent years to 2020 (with this years admissions split between COVID and other). It’s clear that relevant admissions this year (orange plus blue lines) are many times higher than normal in both the first and second waves. 3/9
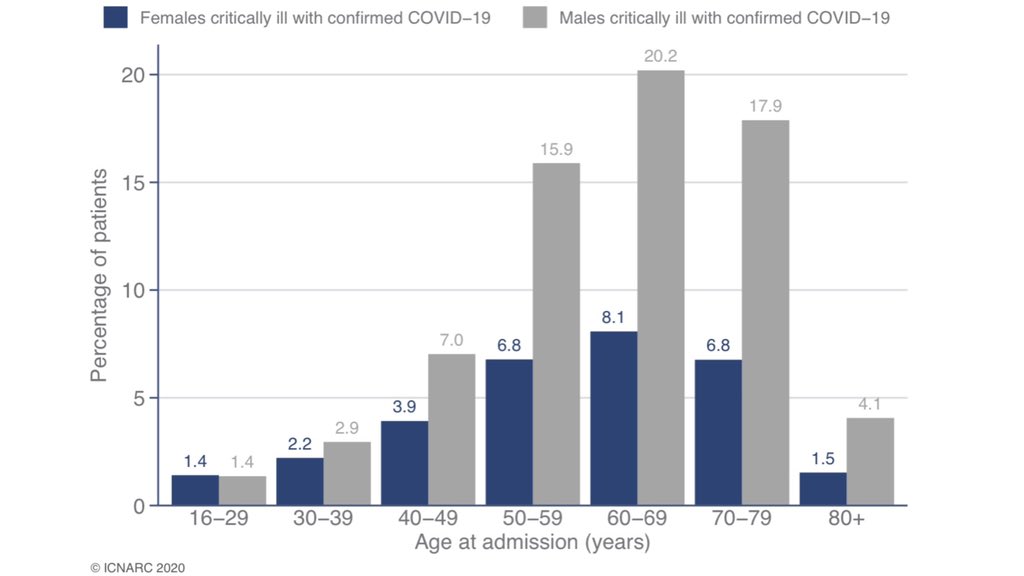
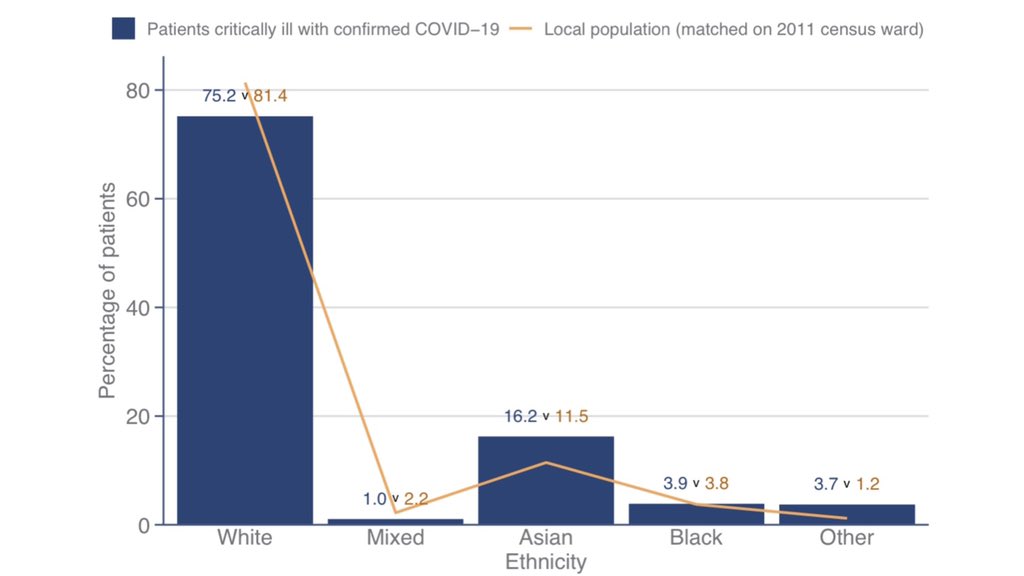
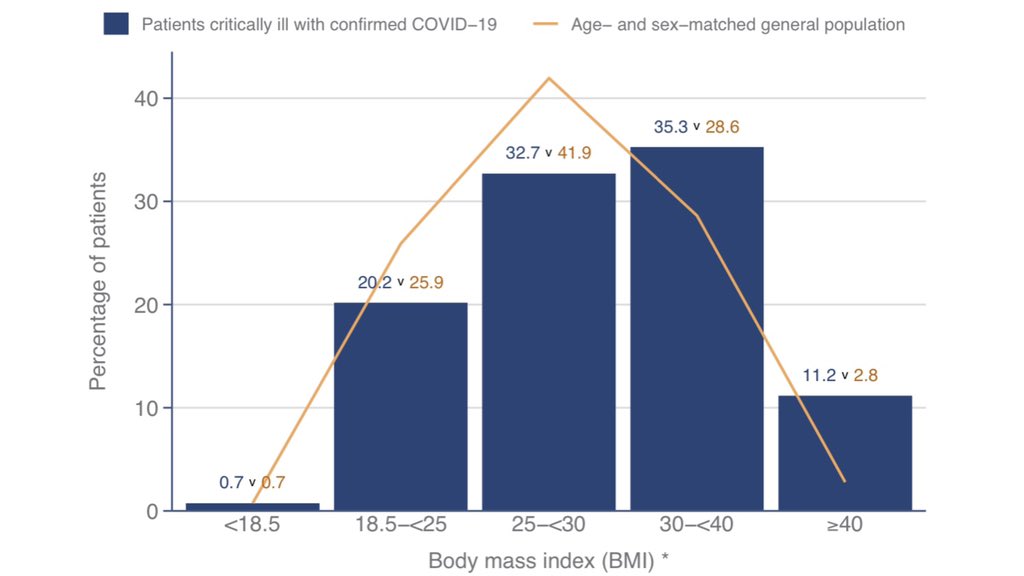
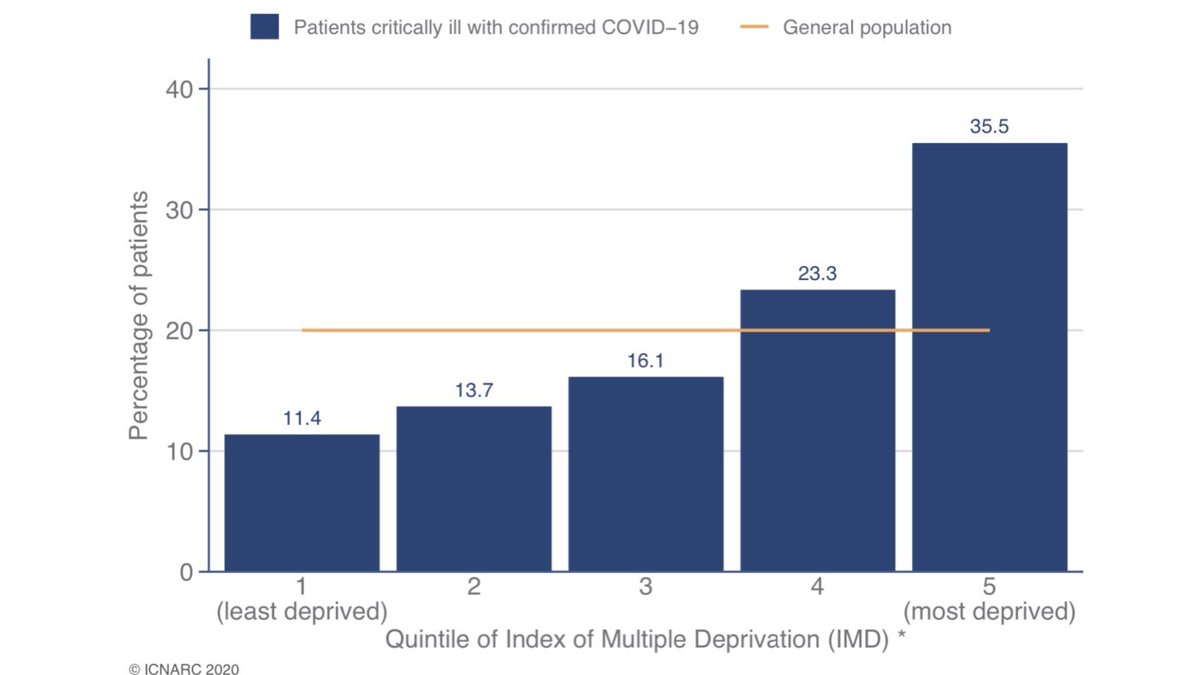
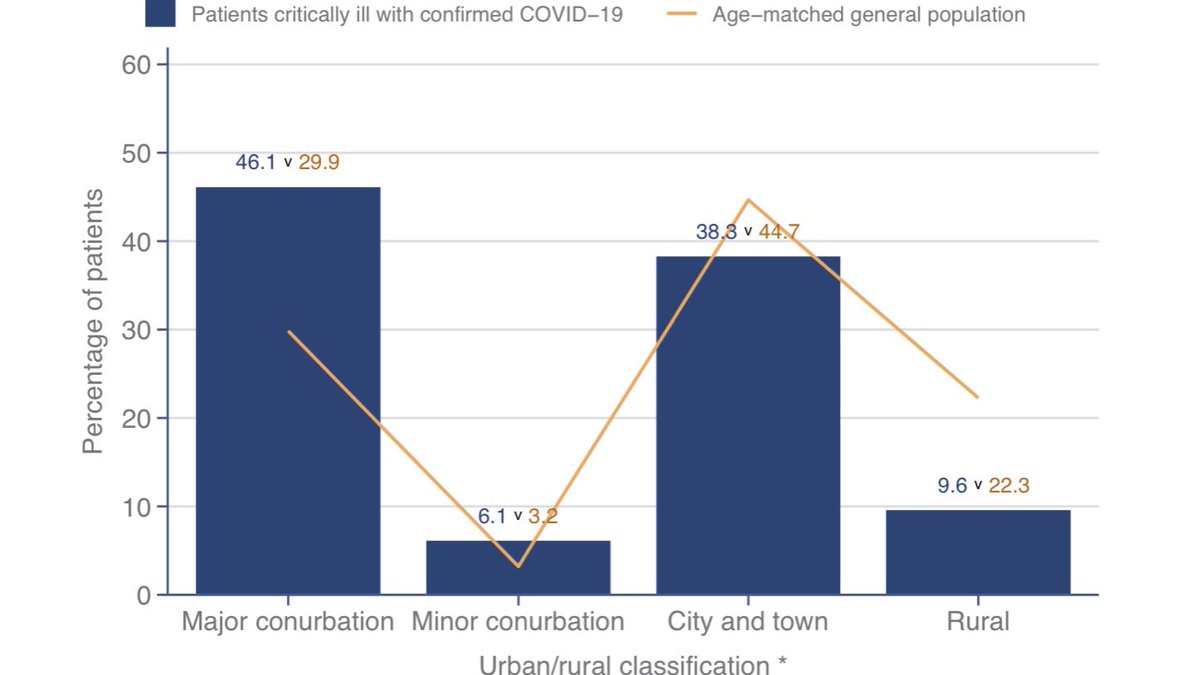
Table 1 and the subsequent charts allow us to examine demographic characteristics compared to what might be expected based on the local population.
Overrepresented groups include males (7 out of 10 ICU admissions), those of Asian ethnicity and the obese (BMI>30). 4/9
Overrepresented groups include males (7 out of 10 ICU admissions), those of Asian ethnicity and the obese (BMI>30). 4/9
Whilst the geographical distribution of ICU admissions is very different in the second wave compared to the first, the same patterns persist. Deprived groups and those living in large cities are much more likely to require critical care. 5/9
Looking at medical history, nine out of ten needed no assistance with daily activities. A similar number were free of severe comorbidities.
Compared to the first wave, patients are much less likely to be mechanically ventilated within the first 24hrs (23% vs 54%). 6/9
Compared to the first wave, patients are much less likely to be mechanically ventilated within the first 24hrs (23% vs 54%). 6/9
Outcomes are still better than the first wave, but the gap has narrowed considerably since I last analysed this report.
Of those no longer in critical care, around one third died in ICU and two thirds were discharged from ICU. 7/9
Of those no longer in critical care, around one third died in ICU and two thirds were discharged from ICU. 7/9
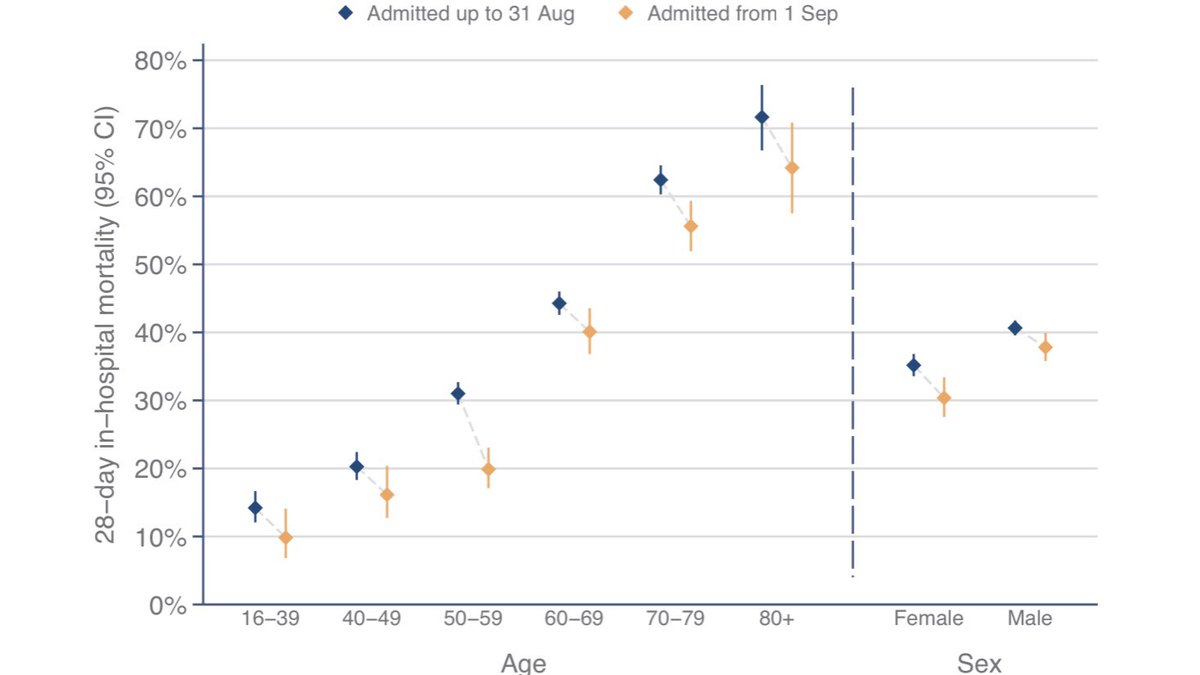
That worsening mortality picture must largely reflect case mix (for example, second wave patients are a bit older on average) as 28-day mortality is improved within each demographic group (though not all of the improvements are statistically significant). 8/9
Here is a link to full report which contains lots of extra information as well as the items I’ve highlighted. In particular more medical breakdowns (I focus more on demographics).
Stay safe! The best way we can help ICU staff is by not catching and spreading this virus. 9/9 https://twitter.com/icnarc/status/1329847643649040395
Stay safe! The best way we can help ICU staff is by not catching and spreading this virus. 9/9 https://twitter.com/icnarc/status/1329847643649040395

 Read on Twitter