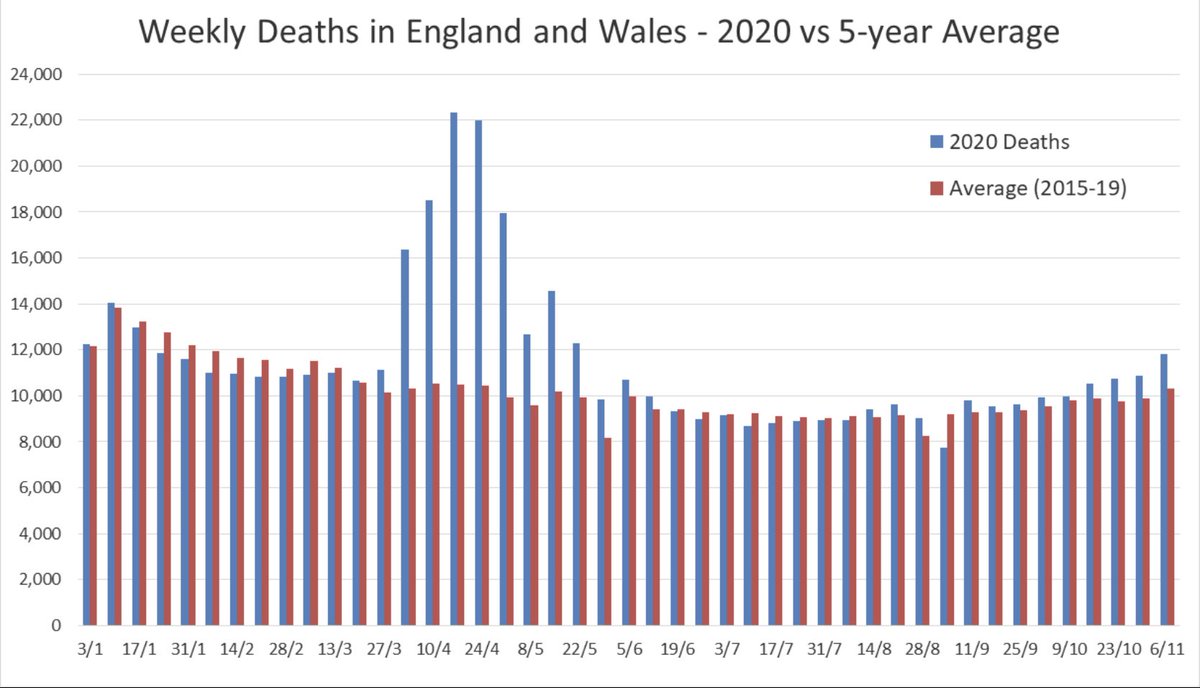
Latest ONS deaths data (to week ending 6 November) has been released.
1,481 more deaths were recorded in-week compared to the 5-year average.
Year to date there have been 13% more deaths than the 5-year average (2015-19).
1,481 more deaths were recorded in-week compared to the 5-year average.
Year to date there have been 13% more deaths than the 5-year average (2015-19).
There are 1,937 deaths where COVID-19 was mentioned on the death certificate this week. However, this was partially offset by deaths from other causes being below normal levels.
Numbers are for England and Wales only and are 11-17 days old.
Numbers are for England and Wales only and are 11-17 days old.
COVID-19 deaths have increased week-on-week for the ninth week in a row, with only a partial offsetting impact from other causes. Total deaths are significantly higher than average.
The second wave is now clearly resulting in significant excess deaths.
The second wave is now clearly resulting in significant excess deaths.
ONS have again added analysis to address the myth that flu is killing more than COVID.
COVID was the underlying cause of death for 9-in-10 deaths “with COVID”.
In contrast, flu or pneumonia was the cause of death for only 1-in-7 deaths “with flu or pneumonia”. https://twitter.com/ons/status/1328633333367132161
COVID was the underlying cause of death for 9-in-10 deaths “with COVID”.
In contrast, flu or pneumonia was the cause of death for only 1-in-7 deaths “with flu or pneumonia”. https://twitter.com/ons/status/1328633333367132161
Best way to compare 2020 to earlier years is to examine age-standardised death rates.
Comparing death counts can be distorted slightly by ageing and growth of the population.
The CMI are reporting weekly using this method. Their Mortality Monitor is due out later today.
Comparing death counts can be distorted slightly by ageing and growth of the population.
The CMI are reporting weekly using this method. Their Mortality Monitor is due out later today.
The CMI report I referred to earlier has been published.
Analysis of age-standardised mortality rates confirms that 2020 mortality is 9% higher than the same week last year. Excess deaths are increasing week-on-week. https://twitter.com/covid19actuary/status/1328704450450526208
Analysis of age-standardised mortality rates confirms that 2020 mortality is 9% higher than the same week last year. Excess deaths are increasing week-on-week. https://twitter.com/covid19actuary/status/1328704450450526208

 Read on Twitter


