Polling aficionados: here is an analysis of 2016 polling, undecideds, and realistic polling error @RealCarlAllen @ReedForecasts @AstorAaron @aedwardslevy @NateSilver538 @Nate_Cohn
Inspiration credit to @RealCarlAllen who has been on this crusade all year apparently.
1/
Inspiration credit to @RealCarlAllen who has been on this crusade all year apparently.
1/
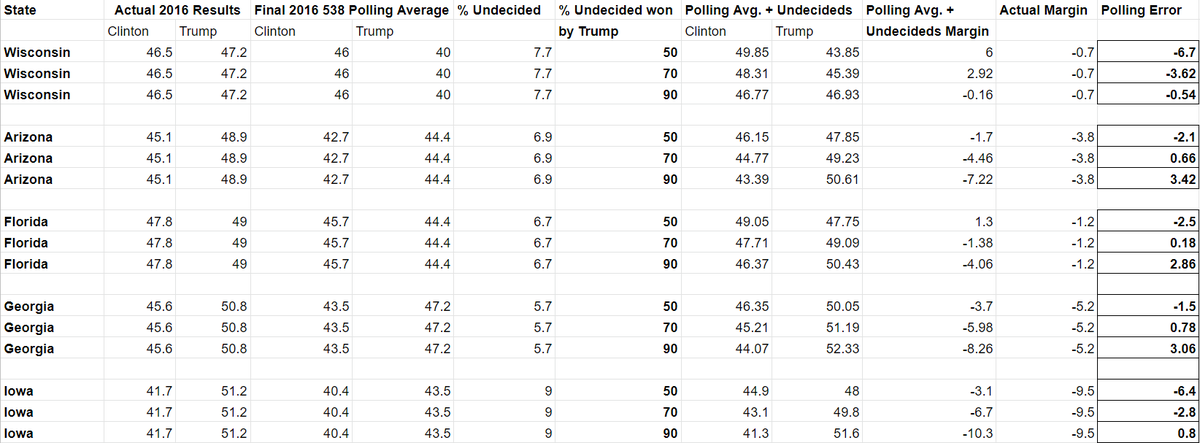
First, the method.
1) Take the 2016 Clinton and Trump numbers in each state
2) Compare to the final 538 polling averages
3) Take the difference in total 2-way count to infer undecideds
4) Allocate undecideds (50/50, 30/70, or 10/90) [even, or favoring Trump]
2/
1) Take the 2016 Clinton and Trump numbers in each state
2) Compare to the final 538 polling averages
3) Take the difference in total 2-way count to infer undecideds
4) Allocate undecideds (50/50, 30/70, or 10/90) [even, or favoring Trump]
2/
(Method cont.)
5) Calculate polling + undecided forecast and compute the predicted margin
6) Compare to the actual margin to infer the "polling error"
The idea is that most discussion of "polling error" assume 50/50 distribution of undecideds. What about if it's different?
3/
5) Calculate polling + undecided forecast and compute the predicted margin
6) Compare to the actual margin to infer the "polling error"
The idea is that most discussion of "polling error" assume 50/50 distribution of undecideds. What about if it's different?
3/
Takeaways:
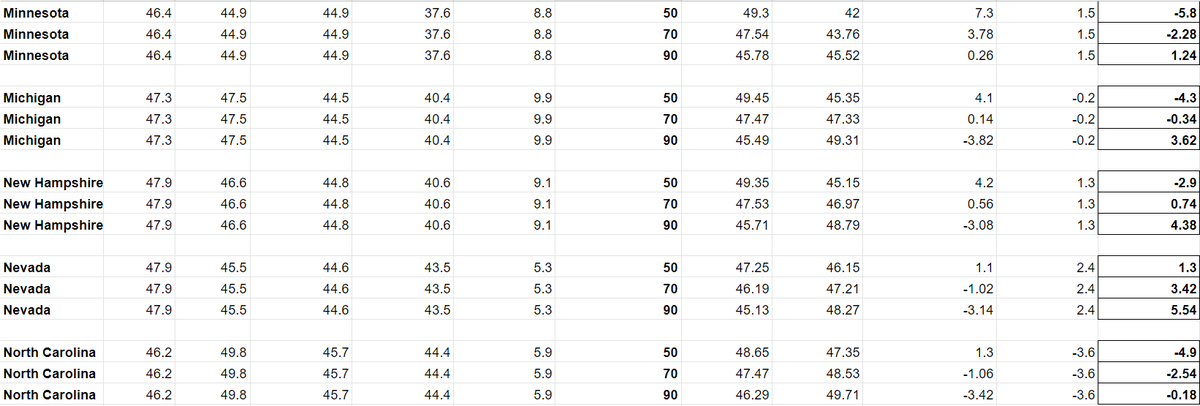
- If you assume that Trump and Clinton split undecideds 50/50, you end up with large "polling error" in Trump's favor, especially in the Midwest (4-7%)
- If you assume Trump won 70% of undecideds, these errors in the Midwest are more like 2-4%
7/
- If you assume that Trump and Clinton split undecideds 50/50, you end up with large "polling error" in Trump's favor, especially in the Midwest (4-7%)
- If you assume Trump won 70% of undecideds, these errors in the Midwest are more like 2-4%
7/
(Takeaways cont.)
- In the Sun Belt, the error was much less, and if 60-70% of undecideds went for Trump there, the polls actually did very well
- Nationally, the polls were accurate if you assume Trump won 60-70% of undecideds (exit polls suggest it was around there)
8/
- In the Sun Belt, the error was much less, and if 60-70% of undecideds went for Trump there, the polls actually did very well
- Nationally, the polls were accurate if you assume Trump won 60-70% of undecideds (exit polls suggest it was around there)
8/
(Takeaways cont.)
- The undecideds split is not necessarily uniform across states, but it would be reasonable to assume:
1) In the Midwest, Trump won 60-70% of undecideds while benefiting from a systematic 3-4% polling error, not an apocalyptic 5-7% error sometimes quoted
9/
- The undecideds split is not necessarily uniform across states, but it would be reasonable to assume:
1) In the Midwest, Trump won 60-70% of undecideds while benefiting from a systematic 3-4% polling error, not an apocalyptic 5-7% error sometimes quoted
9/
(Takeaways cont.)
2) In the Sun Belt, undecideds probably split more evenly, and the polling error varied from 1% for Hillary to 2% for Trump
10/
2) In the Sun Belt, undecideds probably split more evenly, and the polling error varied from 1% for Hillary to 2% for Trump
10/
And now the grand finale: Apply these numbers to today.
Even if you pessimistically assume 2016-style polling errors (e.g. 3-4% for Trump in the Midwest) and undecided breakdown (e.g. 70% for Trump in the Midwest), neither of which is likely...
11/
Even if you pessimistically assume 2016-style polling errors (e.g. 3-4% for Trump in the Midwest) and undecided breakdown (e.g. 70% for Trump in the Midwest), neither of which is likely...
11/
Biden's 51-43 or so lead in MI/WI/MN becomes 50-47 (assuming 3% 3rd party).
Biden's 50-44 lead in PA becomes 49-47
Biden's 49-46 or so lead in AZ/NC/FL becomes 49-48.
12/
Biden's 50-44 lead in PA becomes 49-47
Biden's 49-46 or so lead in AZ/NC/FL becomes 49-48.
12/
In other words, Biden's lead is fairly robust to a realistic assumption of 2016-style polling error *and* undecided breakdown.
You can do this sort of calculation differently with different assumptions of how much of the 2016 miss was polling error vs. undecideds.
13/13
You can do this sort of calculation differently with different assumptions of how much of the 2016 miss was polling error vs. undecideds.
13/13

 Read on Twitter


