A follow up to the thread two weeks ago on rising case counts and "reopening", looking at continued trajectories in states with large epidemics. 1/15 https://twitter.com/trvrb/status/1279187556106723333
When looking at epidemic dynamics, it's worth paying close attention to how the "fundamental reproductive number" changes through time, usually called Rt. This expresses how many secondary infections a primary infection leaves on average. 2/15
Approaches like https://epiforecasts.io/covid/ and https://rt.live/ estimate Rt from confirmed case data. Critically, due to disease incubation period, delays in seeking testing and delays in test reporting, we don't know what Rt is at the very moment. 3/15
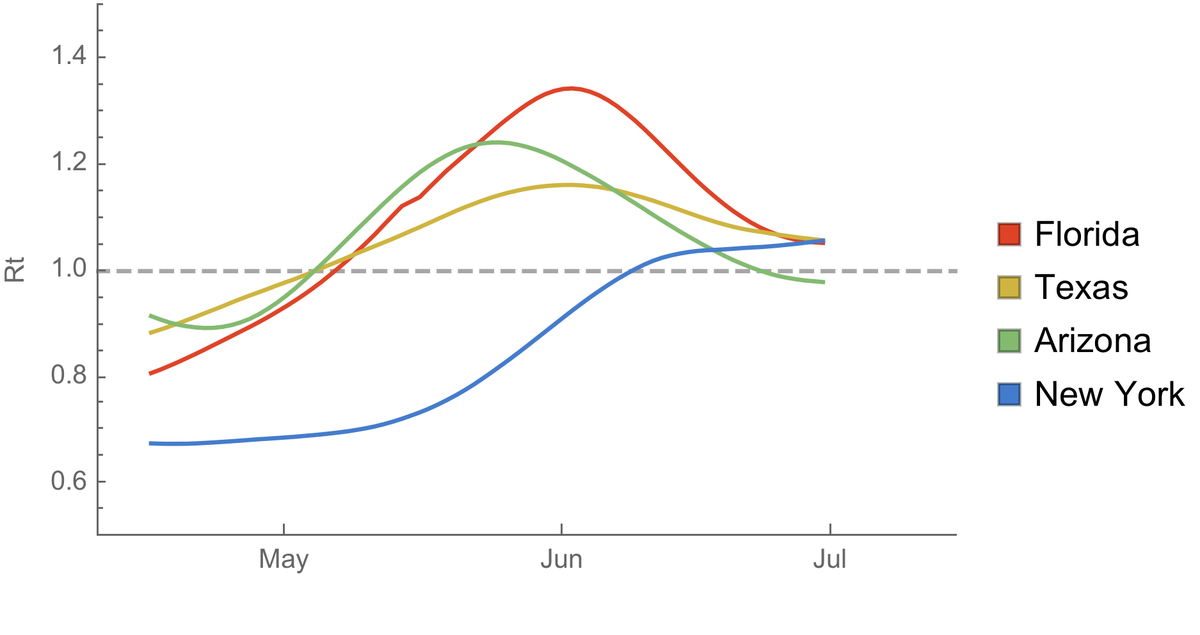
Instead, we can reasonably reliably estimate Rt two to three weeks back. Here, I'm plotting Rt through time for Florida, Texas, Arizona and New York from mid-April to July 1. Rt values were taken directly from https://rt.live/ . 4/15
Rt in Florida, Texas and Arizona decreased over the course of June, but remained over 1 for Florida and Texas. Rt for Arizona fell narrowly below 1 in late June. 5/15
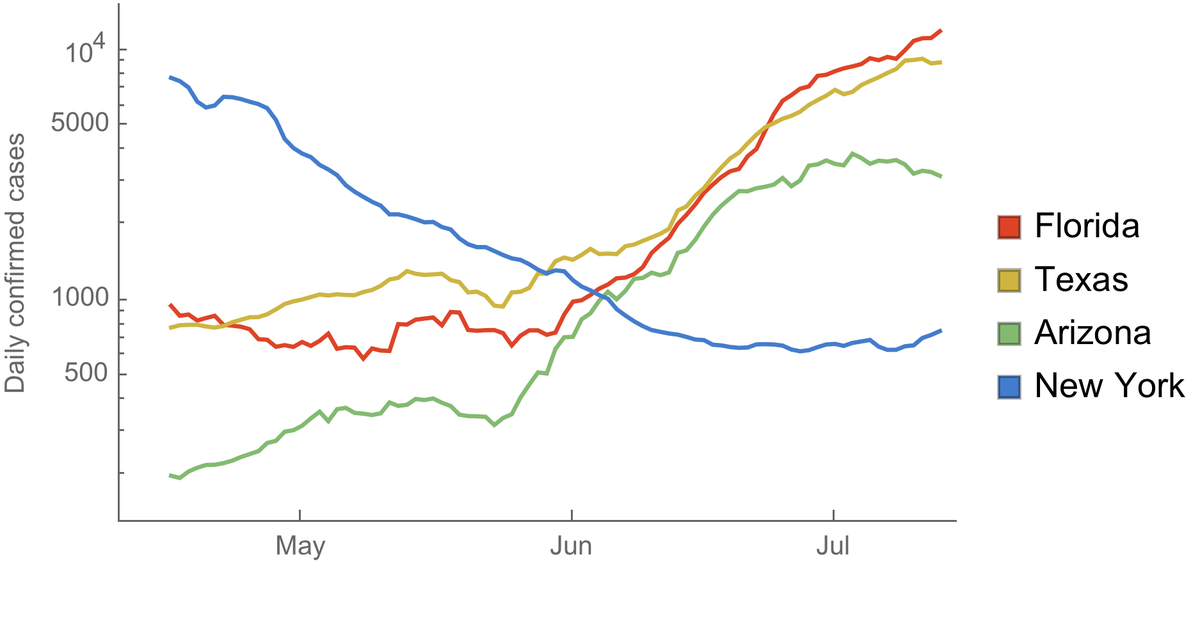
Reductions in Rt manifest as a decrease in the slope of logged cases per day. Here, I'm plotting cases through time from @COVID19Tracking. Because the y-axis is logged, exponential growth is a straight line on this plot. 6/15
You can see that the slope of increase in the first half of June has leveled off for Arizona and is becoming somewhat milder for Florida and Texas. 7/15
This is good news as it indicates that exponential growth in hotspots of Florida, Texas and Arizona is slowing. However, we want the epidemic to subside, not just grow more slowly and so getting to Rt < 1 is incredibly important. 8/15
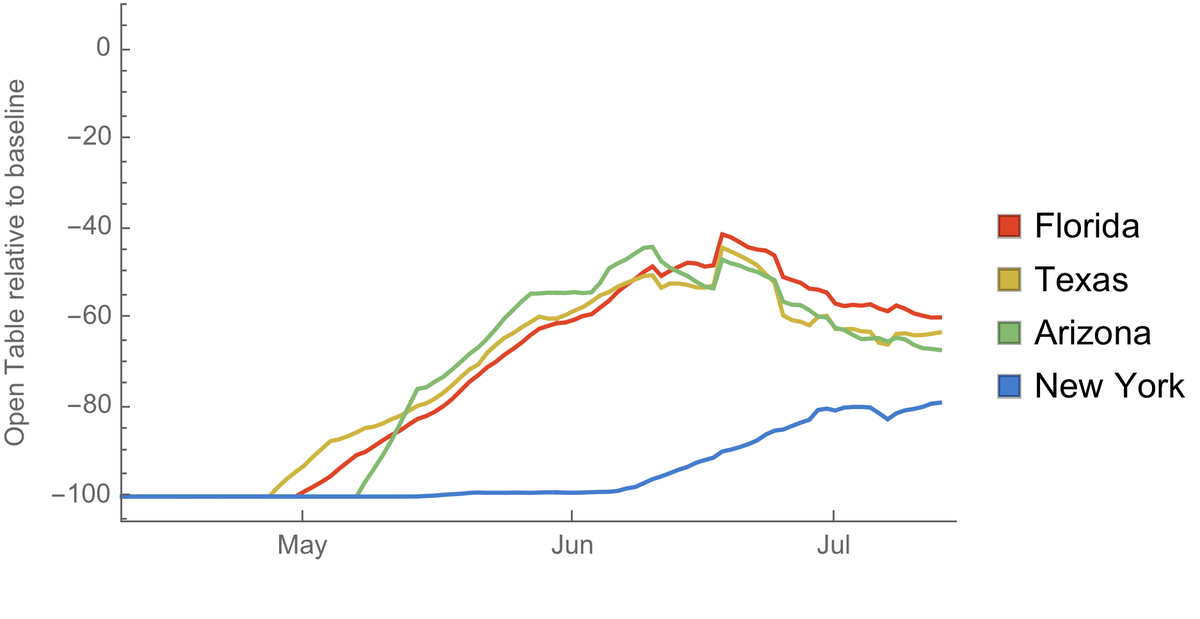
An early indicator of Rt is human behavior and mobility. Here, we can see that @OpenTable data ( https://www.opentable.com/state-of-industry) shows a modest decrease in restaurant reservations in Florida, Texas and Arizona during the second half of June through July. 9/15
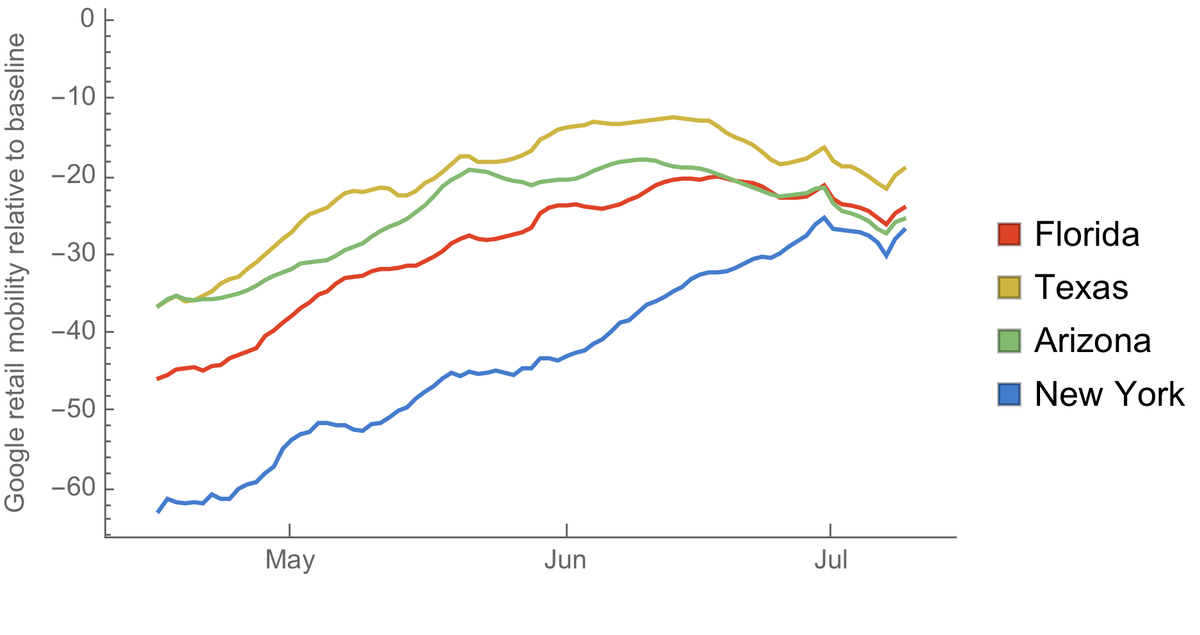
Similarly, @Google data ( https://www.google.com/covid19/mobility/) shows a modest reduction in "retail and recreation" mobility during June and July in Florida, Texas and Arizona. 10/15
If we plot Open Table reservations against Rt, we see that they rise and fall in tandem, and we see a similar pattern in the Google mobility data. 11/15
Thus, I'd expect Rt to continue to decrease in Florida, Texas and Arizona during July, which will become measurable in the next 2 to 3 weeks in case data. 12/15
However, it's not clear whether these very modest reductions in human mobility will be enough to reduce Rt below 1, though the possible peak in confirmed cases in Arizona gives me some hope for Texas and Florida. 13/15
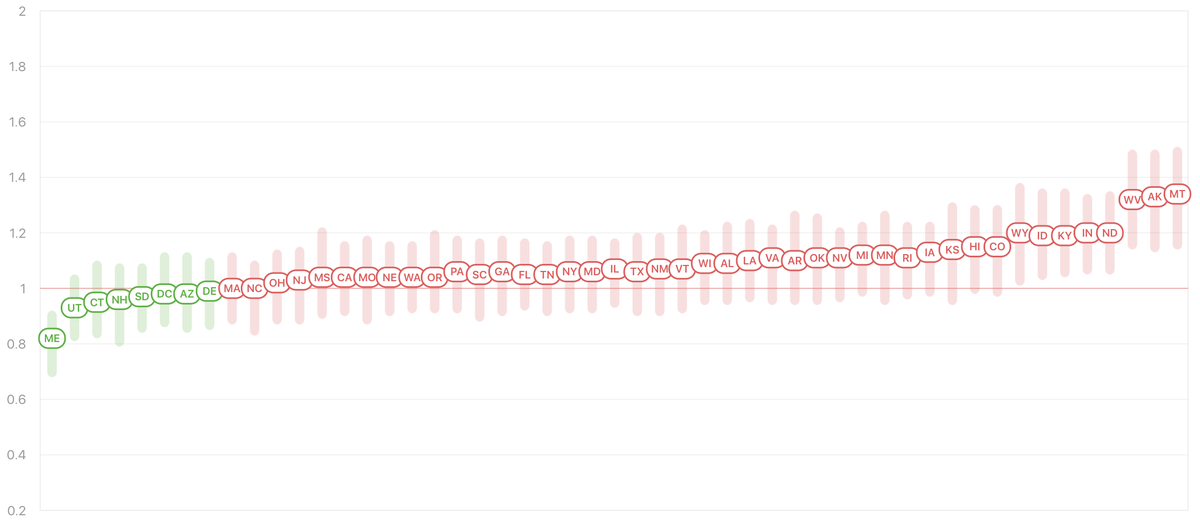
More concerning is the course that the rest of the country seems to be on. https://rt.live/ shows early July Rt greater than 1 in 42 states, with many apparently on a similar trajectory to AZ, TX, FL, just lagged by some weeks relative to those that opened earlier. 14/15
I still think we're generally on course for continued flare-ups and concomitant societal responses to these flare-ups. 15/15 https://twitter.com/trvrb/status/1255976687579181057
Follow up #1: The apparent reductions in Rt, particularly in Arizona, may be influenced by bottlenecks in testing capacity. https://rt.live/us/AZ tries to correct for this, but this is necessarily challenging. https://twitter.com/nataliexdean/status/1284260065751584769
Follow up #2: Although Rt estimates for Arizona may well be influenced by bottlenecks in testing capacity, an additional line of evidence for a slowing epidemic is an apparent recent peak in hospitalizations.

 Read on Twitter