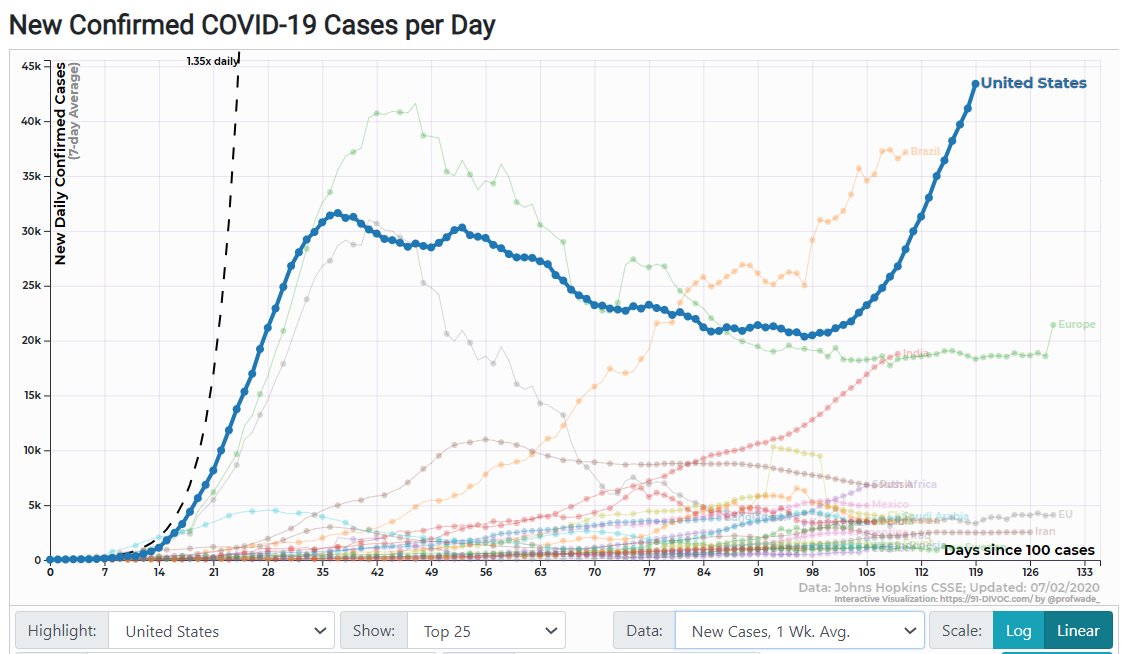
THINK LIKE AN EPIDEMIOLOGIST: There are more new confirmed cases each day in the US than at any time during the earlier April peak. But is it really meaningful to compare those numbers? How do epidemiologists decide when to sound the alarm? A thread. 1/11
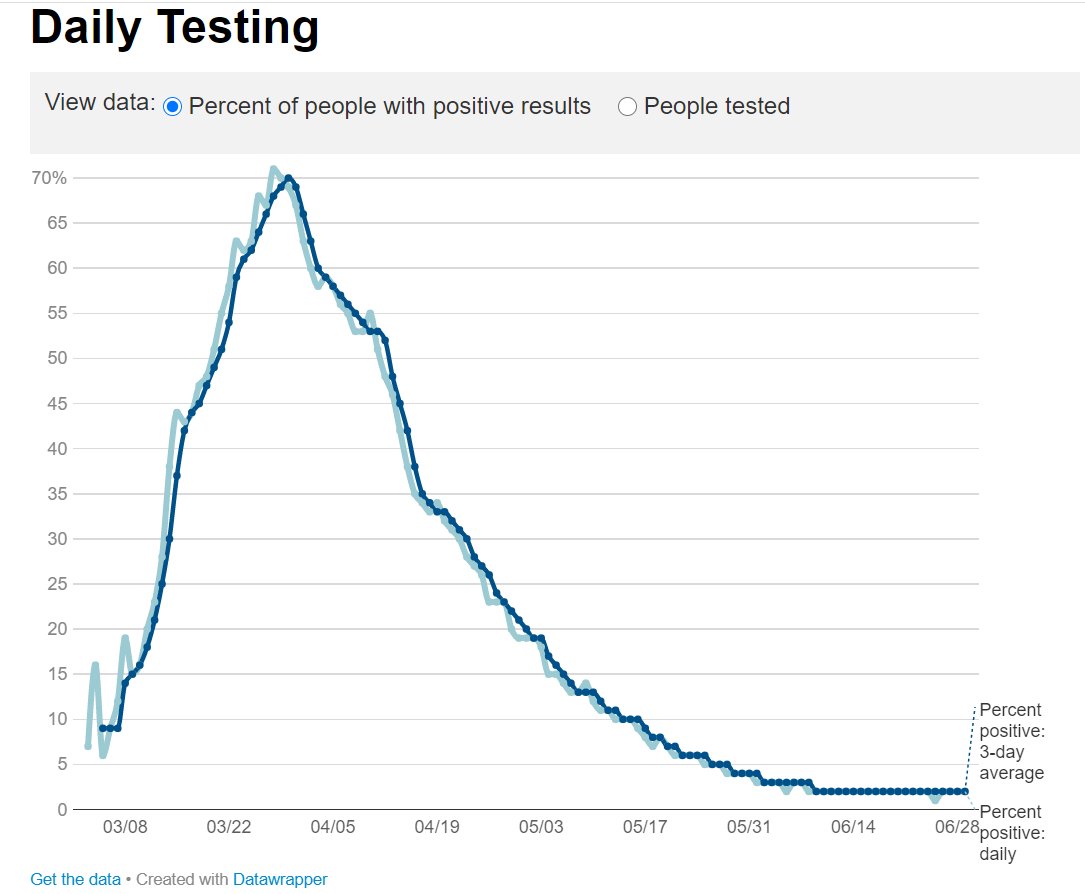
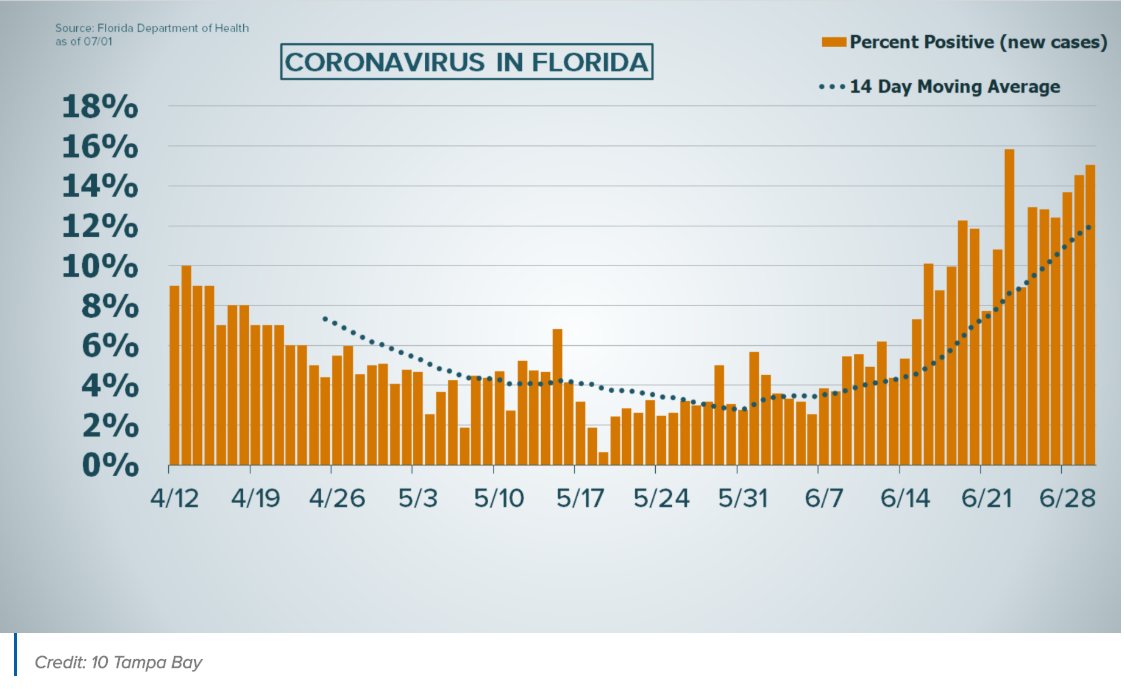
At the peak of NYC's epidemic, over 50% of tests came back positive. Compare that to Florida where positivity is still below 20%. 2/11
Sources: https://www1.nyc.gov/site/doh/covid/covid-19-data.page
http://www.wtsp.com/article/news/health/coronavirus/coronavirus-cases-in-florida-july1/67-91583b41-4ecc-4645-9474-03f6fb0e40fe
Sources: https://www1.nyc.gov/site/doh/covid/covid-19-data.page
http://www.wtsp.com/article/news/health/coronavirus/coronavirus-cases-in-florida-july1/67-91583b41-4ecc-4645-9474-03f6fb0e40fe
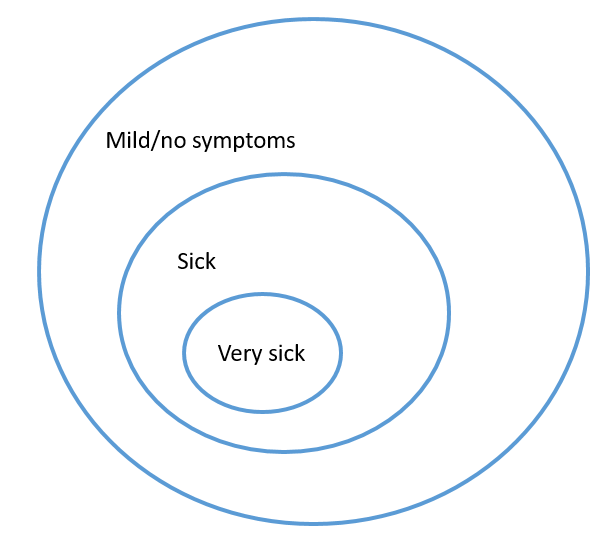
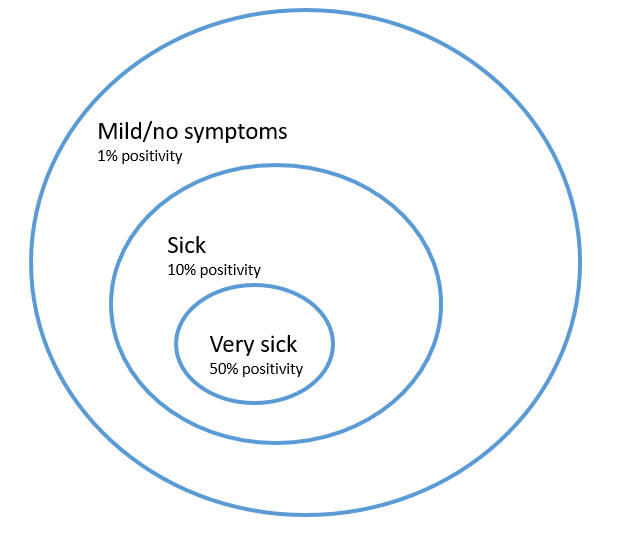
We hear a lot about test positivity being an important metric to track, but I think it's helpful to remind ourselves why. When I think about testing, I tend to imagine dividing the population into tiers. The center is most likely to have COVID. The outer layers less so. 3/11
How does this relate to test positivity? I imagine testing as starting in the center and then radiating outwards. Originally, only the sickest people were getting tested, then people with mild symptoms. Now some places routinely test healthy employees. 4/11
Each tier has its own probability of being positive. Someone with severe respiratory illness could have COVID, but they could have something else (depends on how much COVID is circulating). Let's say hypothetically 50% are positive. I added some numbers to the figure. 5/11
As we have greater capacity for testing, we can move towards the outer tiers, and the test positivity declines. Of course it also declines with how much the virus is circulating in the area. 6/11
Can we adjust the numbers to make them more comparable? @foxjust proposed a simple rule of thumb approach. I think it's helpful to flag that there were likely more new infections at the mid-April peak than now, but of course nothing is easy. 7/11 https://twitter.com/bopinion/status/1278727658709430272?s=20
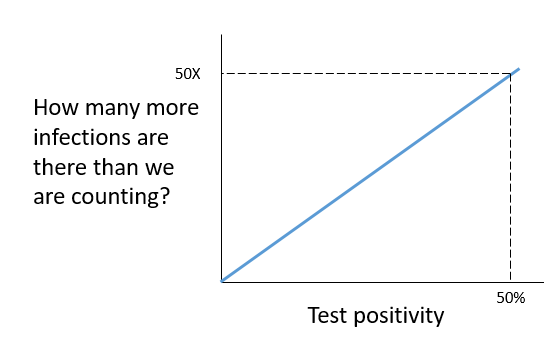
The adjustment looks like this. Whatever the test positivity was (10%, 50%), multiply the number of new cases by that (10X, 50X). This assumes that there is a linear relationship between test positivity and the amount of the epidemic we are missing. 8/11
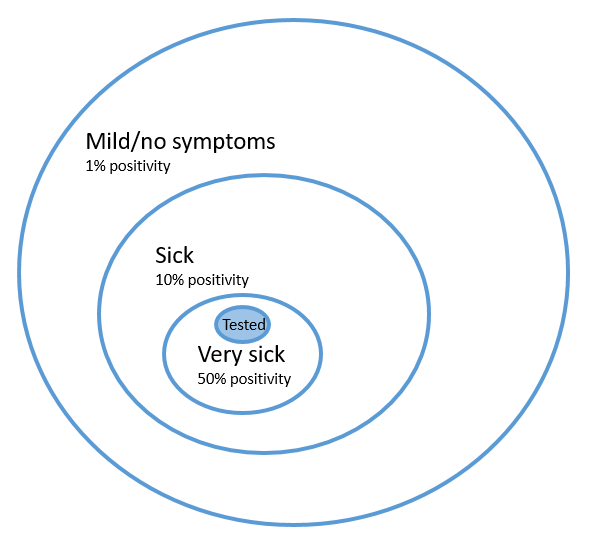
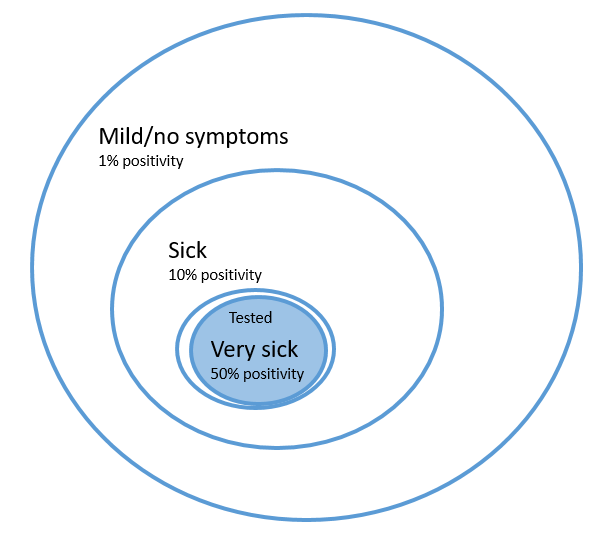
But we can dream up settings where it's not linear. Imagine you only test a few very sick people. They are 50% positive. We test more people, and they are also 50% positive because they are like the others. We have captured more infections, but positivity hasn't changed. 9/11
All of this to say, there isn't an easy way to meaningfully compare case counts. Ideally we could calibrate test positivity to the total number of infections, using serosurveillance data. Instead of absolute numbers, I find it more helpful to examine trends. 10/11
What we see in states like Florida is a sharp rise in the numbers of new cases. It is the pace of growth that alarms me, and the fact that positivity is rising along with it. As policy hasn't changed over the last few weeks, what stops it from rising more? 11/END

 Read on Twitter