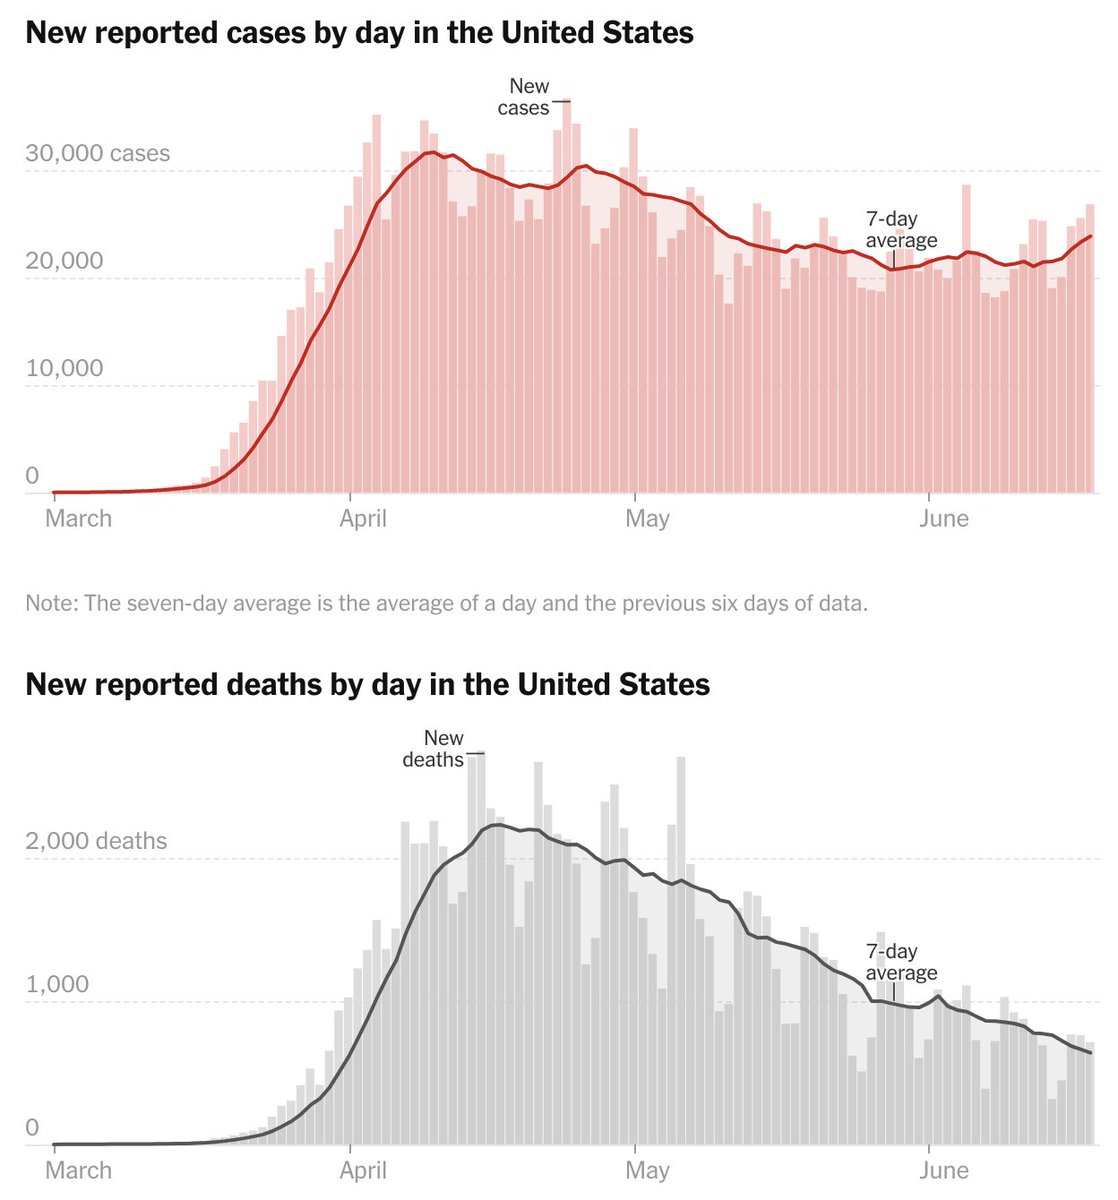
A small follow up to the "long plateau" assessment of the #COVID19 epidemic. When I tweeted this on April 30, we had ~30k daily confirmed cases and ~2000 daily deaths. This last week, we had ~24k daily confirmed cases and ~700 daily deaths. 1/10 https://twitter.com/trvrb/status/1255976675252158465
In the past 7 weeks, daily confirmed cases have decreased to ~80% of their April 30 value, while daily deaths have decreased to ~35% of their April 30 value. Figure from @nytimes. 2/10
Testing has increased by about 2-fold in these 7 weeks. Given continually increasing testing, alongside roughly stable confirmed cases and declining deaths, we expect that the national US epidemic has been getting slowly smaller. 3/10 https://twitter.com/COVID19Tracking/status/1273739589937623040
Consistent with this, we see from @COVID19Tracking that nationally test positivity has shrunk. 4/10 https://twitter.com/COVID19Tracking/status/1270845607310024704
However, given what know about severity vs age, we really want to understand what's going on across different age groups. After digging around, the only source I could find that splits confirmed cases by age through time is @CDCgov's COVIDView ( https://www.cdc.gov/coronavirus/2019-ncov/covid-data/covidview/index.html). 5/10
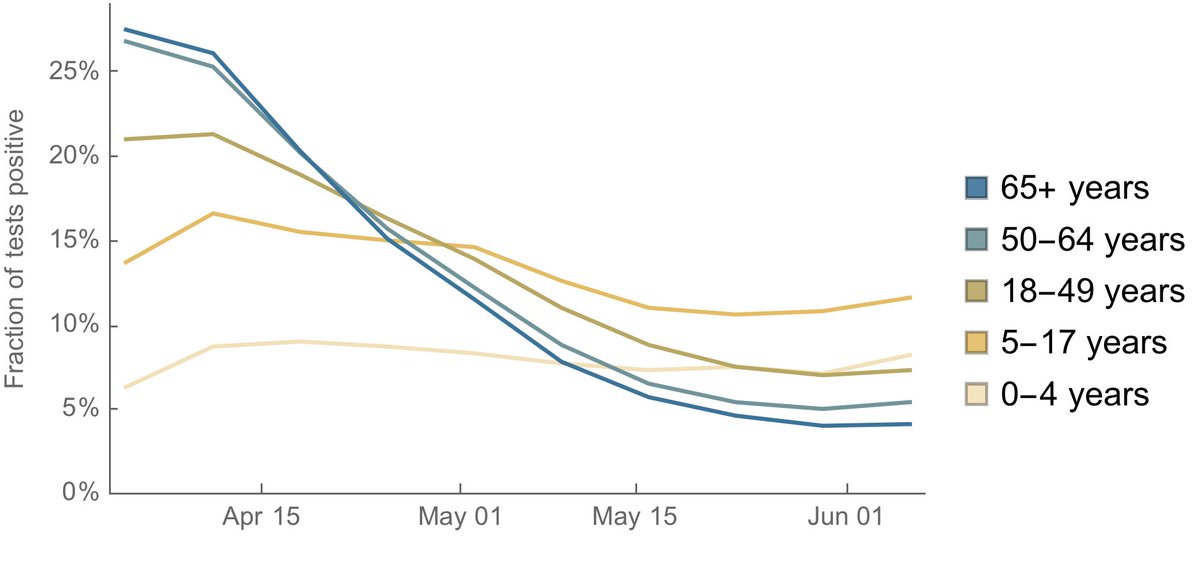
Here, I downloaded COVIDView data and slightly prettified their plots. If we look at testing in commercial labs, we see that across confirmed cases, there are slightly more cases in the 0 to 49 year demographic than there were in April. 6/10
But if we look at fraction of tests that are positive we see a very strong signal in which ages 0 to 17 are nearly flat through time while 50 and over show a strong decrease in test positivity from April to June going from over 25% to 4-5% who test positive. 7/10
It's difficult to quantify this, but it looks like infections may have declined more in vulnerable older individuals. This is possibly contributing to declining daily deaths. Though it's also possible that improvements to clinical care have lead to better patient outcomes. 8/10
This would make sense, in that we should expect people to act somewhat rationally and attempt to better isolate if they're more at risk and have the resources to do so. Though note as well that essential workers will generally skew younger. 9/10
With "reopening", we may see this trend in age distribution continue. This should ameliorate some of the health impacts of COVID-19, but will necessarily only go so far. There is no way to completely isolate vulnerable individuals from a widespread epidemic. 10/10
Follow up #1: I should have made it clear that some (or perhaps most) of the effect in tweet 7 could be due to rationing of tests in April to the most severe cases. Because severe cases skew older, this will sieve torwards greater test positivity in older individuals.
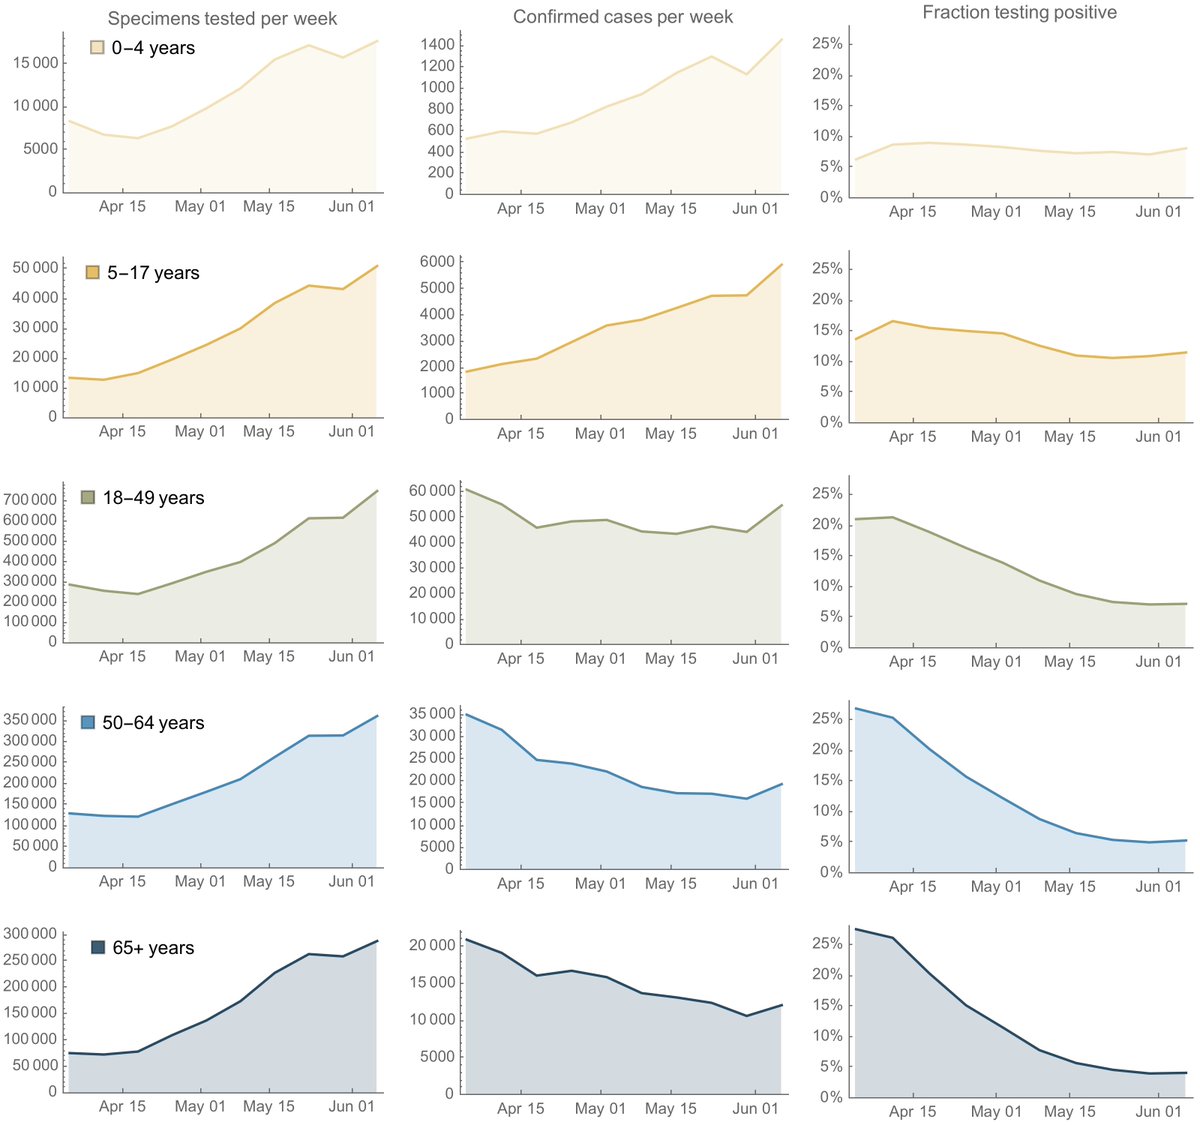
Follow up #2: Here's a more complete figure showing specimens tested, confirmed cases and fraction of specimens testing positive across age groups. Again, data is directly from @CDCgov's COVIDView.
Follow up #3: Looking at this plot, we see that in the 18-49y cohort, testing increased 2.6X between Apr 4 and June 6, while confirmed cases decreased 1.1X. In the 65+ cohort, testing increased 3.8X while confirmed cases decreased 1.7X.
Follow up #4: Thus, in the 65+ cohort testing increased more, but cases decreased even further. Some of this shift in age of confirmed cases is certainly from broadened testing, but I don't see any obvious way to get this specific result without a partial shift in infections.

 Read on Twitter


