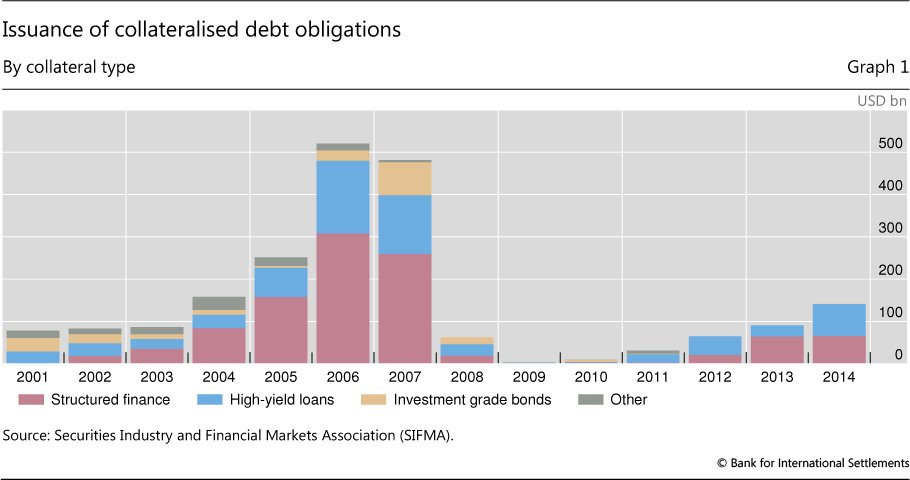
Generally, one sign of a mania is that following price increases, promoters create supply to meet insatiable demand. Gotta feed the ducks and all.
So in the 90s, you get a stock market boom and shares of tech stocks go up rapidly in price, and then you get a lot of issuance of tech shares.
Or, people wanted a lot of AAA assets, and this one is a little harder to see, but if you look at the maroon bar, Wall St. created a lot of AAA assets.
Now, thinking back to the first chart, what's weird is, there hasn't been a big pick up in equities. And housing starts are just now starting to recover to levels that used to be recessionary.
No points if you know where this is going tbh
This was obviously a terrible joke because my god was it wrong https://twitter.com/modestproposal1/status/875759361729212419
But if you are looking for a place where large increases in asset prices is meeting large increases in supply, US equities and US housing is not going to be your focal point
I will end this thread where I started, with something interesting that caught my attention over the weekend. 3000. https://twitter.com/business/status/949713539534589952

 Read on Twitter

![[another chart of tech IPOs] [another chart of tech IPOs]](https://pbs.twimg.com/media/DTCxhjwVoAAK_PB.jpg)


