Good morning, I think we haven't talked enough yet about that new paper on cost-sharing for drugs in Medicare: https://tradeoffs.org/2021/02/19/the-deadly-costs-of-charging-patients-more-for-prescriptions/
The findings are staggering, and we talked about that, but we haven't discussed how clever and creative the methods in the paper are.
The findings are staggering, and we talked about that, but we haven't discussed how clever and creative the methods in the paper are.
The paper starts by exploiting the fact that prescription drug plan generosity in the first year is conditional on your birth month, because most people enroll in Medicare in the month they turn 65.
So, in that first year of enrollment, people born later in the calendar year are less likely fall into Part D's "donut hole," which would require them to pay more out of pocket before the January deductible reset.
That's a fine and interesting source of variation, you might think, but how do you construct a counterfactual? You can't just use actual end-of-year spending on or consumption of drugs, because those are endogenous to cost-sharing.
Never fear, dear reader.
Never fear, dear reader.
The authors turn to Medicare enrollees who qualify for the low-income subsidy in Part D, which means they face very little cost-sharing for drugs, regardless of when in the year they enroll in the program.
Now, you can't just make that group your control group. By virtue of being in the LIS category, this population qualitatively different from other Part D enrollees. You can control for observable confounders, but there are probably a bunch of unobservables lurking, too.
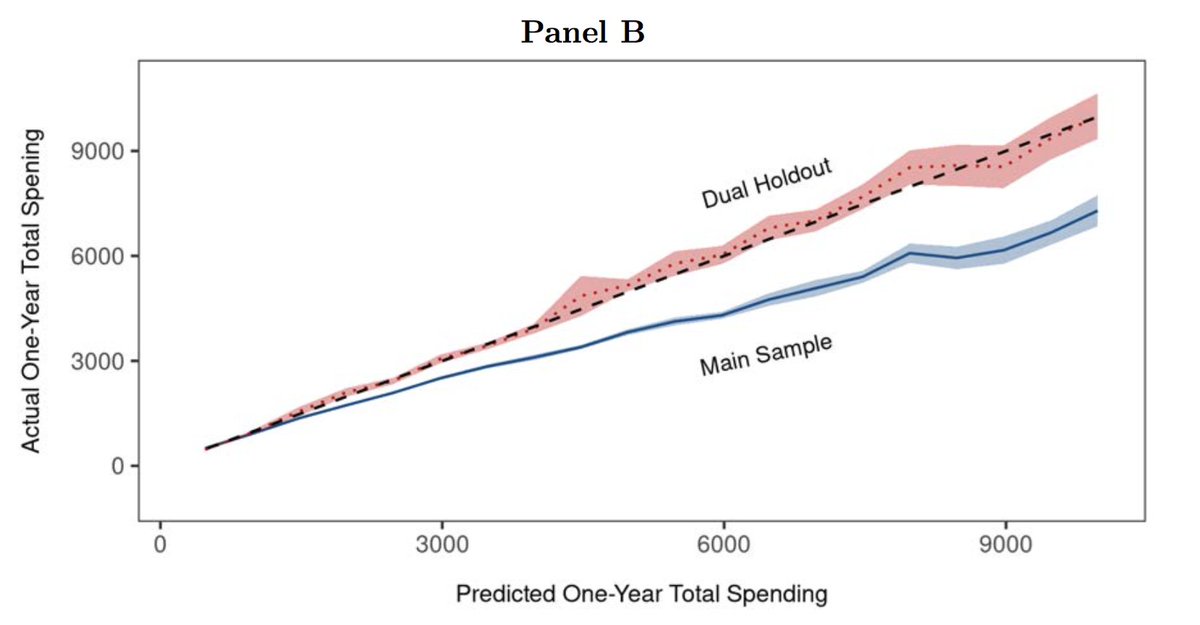
What the authors do is use that population to train a machine learning algorithm to *predict* end-of-year spending on a host of individual-level covariates drawn from demographic and claims data. They used 1,770 variables to train this algorithm.
They then take that algorithm out of the LIS setting (where it performed really well, check how that tracks the dashed 45-degree line) and implemented it in the study population, to create unbiased estimates of end-of-year spending.
I completely agree we should talk about the results more, too—especially the fact that high-risk populations were affected *more* than the low-risk, which flies in the face of the theoretical models that have undergirded health economics for decades https://twitter.com/mhstein/status/1362757771603697670
It's a very well done, extremely important paper. It may not have the flash of explicit randomization, like we had in RAND and OHIE—but those had sample sizes much too small to detect changes in mortality.
Like those, this paper feels like a game-changer.
Fin.
Like those, this paper feels like a game-changer.
Fin.

 Read on Twitter


