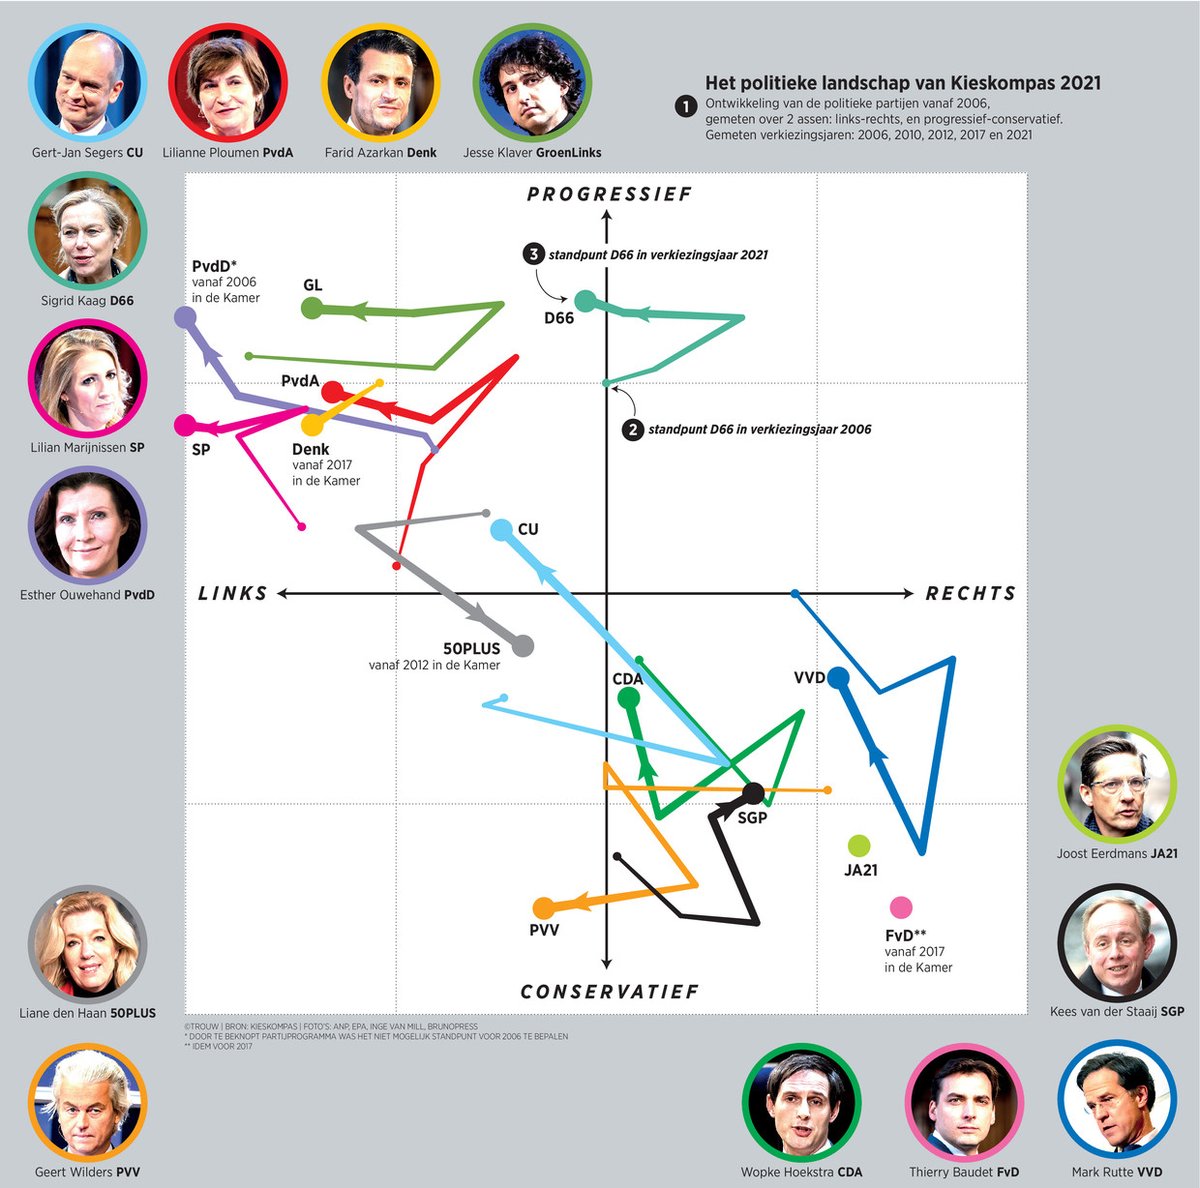
I did a thread on the many "voter match" tests for the #Netherlands elections, which are used by millions, last week. Today the @Kieskompas launched, and it's helpful not just in showing party positions on two axes — left/right and progressive/conservative — but changes over time
When comparing this year's positions with 2017, there's a "massive shift to the left on economic policy," this piece says, and most parties also became a little more progressive: https://www.trouw.nl/politiek/politieke-partijen-schuiven-massaal-op-naar-links~b184d362/
Think that's a tad exaggerated tbh, but here's a side-by-side comparison:
Think that's a tad exaggerated tbh, but here's a side-by-side comparison:
Gets more interesting when tracking the changes in party positions since 2006.
You can see a rightward shift from 2006 to 2012 (for PvdA, GL, D66, CDA, VVD, CU, SGP);
And yes, a shift back to the left in 2012-2017 (for SP, PvdD, GL, PvdA, D66, CU, CDA, VVD)
You can see a rightward shift from 2006 to 2012 (for PvdA, GL, D66, CDA, VVD, CU, SGP);
And yes, a shift back to the left in 2012-2017 (for SP, PvdD, GL, PvdA, D66, CU, CDA, VVD)
Also noteworthy that almost all progressive parties have become more so (SP, PvdD, GL, PvdA, D66), while on the right VVD and CDA lurched to more conservative positions in 2010 and again in 2017, but moved back towards the centre now.
Chart source: https://www.trouw.nl/politiek/identiteitspolitiek-rukt-op-bent-u-anti-migratie-dan-heeft-u-waarschijnlijk-geen-warmtepomp~bcd2ed36/
Chart source: https://www.trouw.nl/politiek/identiteitspolitiek-rukt-op-bent-u-anti-migratie-dan-heeft-u-waarschijnlijk-geen-warmtepomp~bcd2ed36/
Only one party consistently moved one way. When Geert Wilders launched the PVV it was economically right-wing as well as anti-Islam/immigration. But Le Pen-style "welfare chauvinism" (per @AndreKrouwel) offered better electoral prospects.
The other party that's been steering across quadrants is the CU: originally a merger of two Calvinist parties counted among "the small right", now a centre-left party with a broader appeal among eg evangelicals.
Here's the original thread: https://twitter.com/almodozo/status/1360282059080663040
Here's the original thread: https://twitter.com/almodozo/status/1360282059080663040
All of this is based on party positions. How parties behave and vote in practice is a different matter. There are other tools that focus on that (Stemmentracker, Stemchecker), but keep in mind that eg the PVV tends to 'talk left but vote right'.
Another point to keep in mind is that the Kieskompas selects questions on the basis of current concerns — they're different every time.
@SimonOtjes argues for this reason against using charts like the above to assess changes in party ideology over time: https://twitter.com/SimonOtjes/status/1361954541252595713
@SimonOtjes argues for this reason against using charts like the above to assess changes in party ideology over time: https://twitter.com/SimonOtjes/status/1361954541252595713
Might be less of a concern for foreigners loosely using them to get their initial bearings, but makes it interesting to compare w/ @manifesto_proj charts, which are based on a consistent set of criteria.
Some of the same things show up there, eg PVV moving left economically:
Some of the same things show up there, eg PVV moving left economically:

 Read on Twitter


