New cases of covid19 continue decline in both Ventura County and California. Hospitalization rates continue to decrease in both VC and CA. Covid deaths continue to decline. Humans are winning. #Covid19 data as of 02/16/21 from the CA Open Data Portal.
1/6
1/6
Total Cases VC: 76043, CA: 3416147
Total Hosp VC: 202, CA: 8215
Total ICU VC: 48, CA: 2439
Total Death VC: 751, CA: 47507
2/6
Total Hosp VC: 202, CA: 8215
Total ICU VC: 48, CA: 2439
Total Death VC: 751, CA: 47507
2/6
Change in Cases VC: 154, CA: 4090
Change in Hosp VC: -14, CA: -244
Change in ICU VC: 0, CA: -48
Change in Death VC: 19, CA: 400
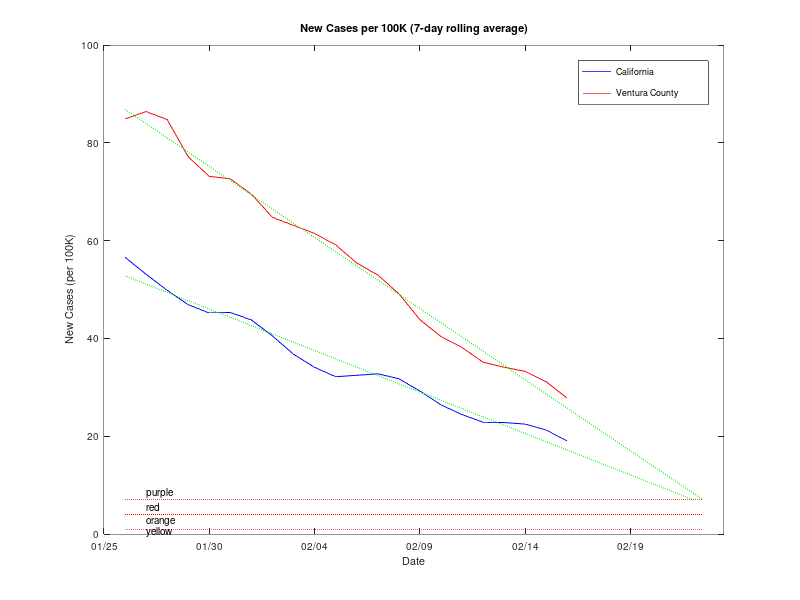
New cases were below predicted levels in VC and significantly below predicted in CA. Still on target to reach 'red' level by Feb 23.
3/6
Change in Hosp VC: -14, CA: -244
Change in ICU VC: 0, CA: -48
Change in Death VC: 19, CA: 400
New cases were below predicted levels in VC and significantly below predicted in CA. Still on target to reach 'red' level by Feb 23.
3/6
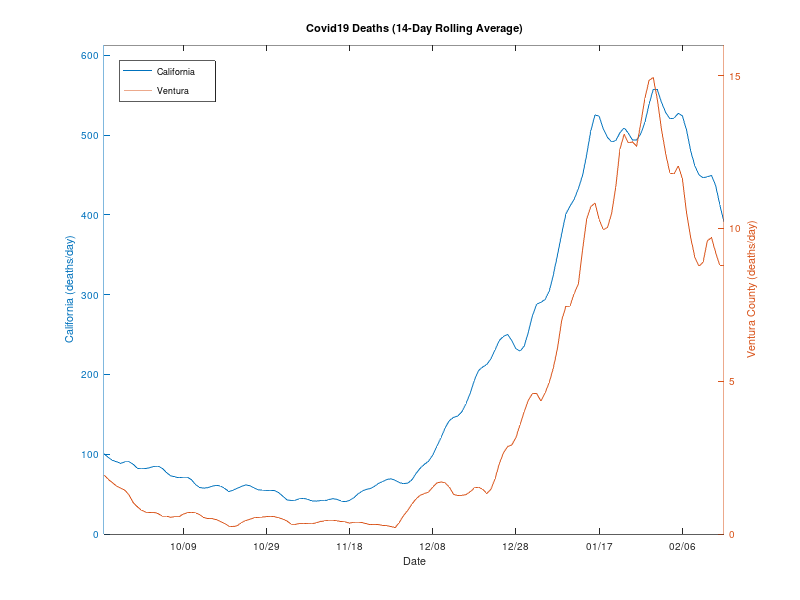
Hospitalization continues to decline in VC and CA. The number in ICU continued to decline in CA. Death rate is now at 8.78 deaths/day in VC (range 7.68-9.87) and 391 deaths/day in CA (range 364-418) (14-day averages).
4/6
4/6
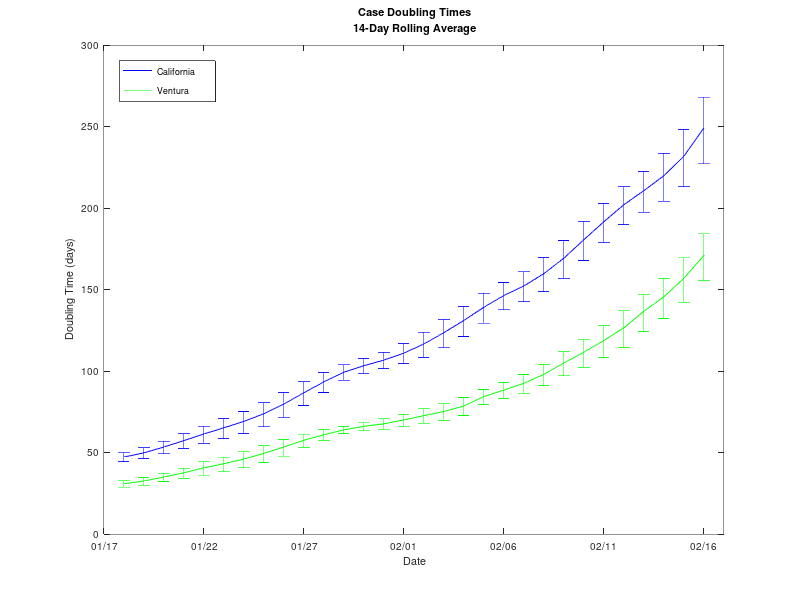
Doubling times for new cases are at 171 (range 158-186) days in VC and 249 (range 230-271) days in CA. New cases in VC averages 301 (range 277-324) per day and 9345 (range 8609-10081) per day in CA. (14-day averages)
5/6
5/6
Predictions for tomorrow:
VC new cases 310. CA new cases 9540.
If the actual number is lower, the humans are winning.
6/6
VC new cases 310. CA new cases 9540.
If the actual number is lower, the humans are winning.
6/6

 Read on Twitter


