1/ By popular demand I was going to do a deep dive into the European CDC Face Mask recommendation study. Well, it may end but be a bit shallow. There is not much depth to be diving into. https://www.ecdc.europa.eu/en/publications-data/using-face-masks-community-reducing-covid-19-transmission
2/ The study follows a usual form with clear inclusion and exclusion criteria (which is good). It uses the GRADE framework to ascertain the evidence and generate a recommendation. That is among the best we got in the evidence based land.
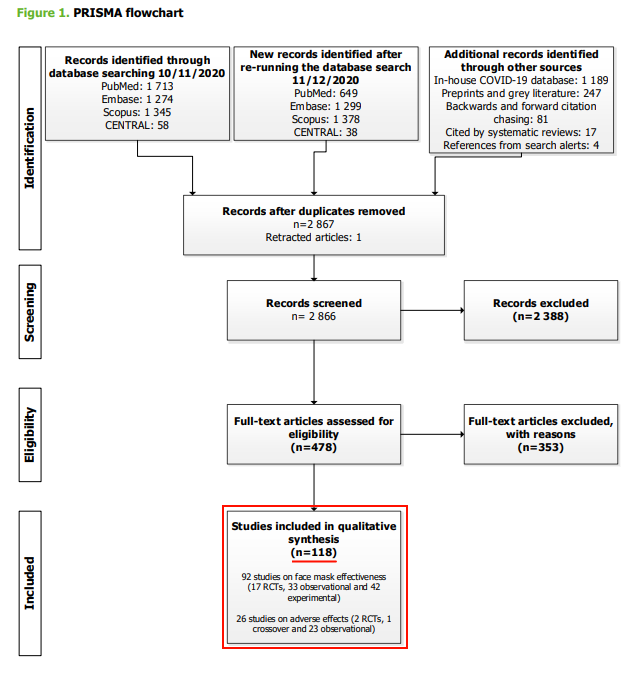
3/ The number of studies included is 'interesting'. With a n=118 we would expect to get a nice body of clear cut evidence to support the recommendation.
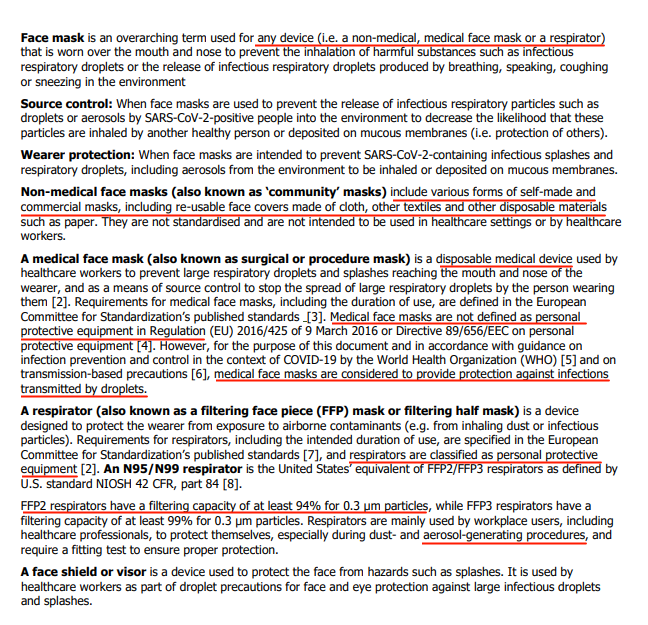
4/ The glossary is interesting. Interesting to note, medical face masks are not considered to protect against aerosol while the respirator N95/N99 is. Keep this in mind for the future.
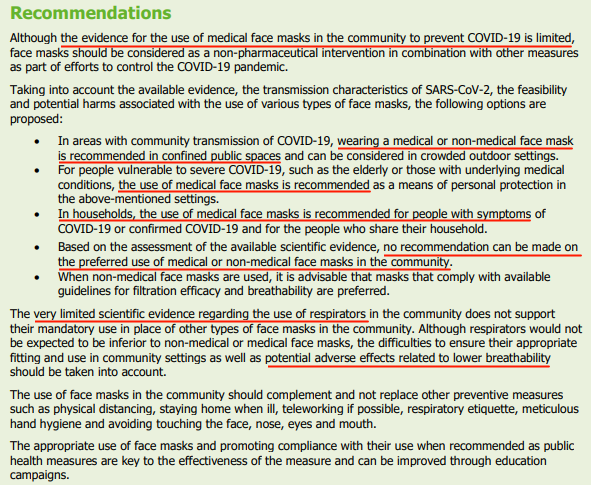
5/ Let's just skip straight to the recommendations so we can asses properly the rest of the study. So far, so good. The recommendation is 'Use masks' in whatever setting. Let's see if the evidence agrees.
6/ For anyone that knows GRADE, there is a certain format any study has to follow and a way to evaluate the data. While subjective it helps to keep ourselves objective, BUT there is a key point in where subjectivity can creep in. The evidence certainty rating.
7/ In order to have a better assessment lets focus on the key objective metrics of the part of the study the authors actually provide the data. (more on this later)
For details on what each one means I suggest this article written by Gordon Guyatt himself https://bestpractice.bmj.com/info/toolkit/learn-ebm/what-is-grade/
For details on what each one means I suggest this article written by Gordon Guyatt himself https://bestpractice.bmj.com/info/toolkit/learn-ebm/what-is-grade/
8/ The setting is where the study has been performed at, in here we see community (which is what is interesting for this recommendation), households, health care facilities and/or mixed environments.
Community = 7
Household = 2
Health care = 9
Mixed = 2
Community = 7
Household = 2
Health care = 9
Mixed = 2
9/ The risk of bias is a metric that encompass the general result of looking at the bias part of the table where individual biases are assessed. Here comes the first surprise.
No = 1
Serious = 16
Very serious = 2
Yes, you read it right. A SINGLE study without risk of bias!!!
No = 1
Serious = 16
Very serious = 2
Yes, you read it right. A SINGLE study without risk of bias!!!
10/ But this is a 'deep dive' what is the distribution of 'potential' biases distributed in all the studies shown in the supplementary?
No bias = 0
1,2 biases = 6
3,4 biases = 20
5,6 biases = 11
Only 6 studies have 2 or less biases identified. And NONE has ZERO.
No bias = 0
1,2 biases = 6
3,4 biases = 20
5,6 biases = 11
Only 6 studies have 2 or less biases identified. And NONE has ZERO.
11/ Now lets look to the 'indirectness' metric. So here the authors were kind enough to classify 8 of them as Serious or Very Serious. From 20 studies only 4 are not 'indirect'. And half of the rest are Serious or worse.
No = 4
Yes = 8
Serious = 5
Very Serious = 3
No = 4
Yes = 8
Serious = 5
Very Serious = 3
12/ How about 'imprecision'? In this one we are better, we are split almost in half.
No = 11
Yes = 7
Serious = 2
No = 11
Yes = 7
Serious = 2
13/ 'Inconsistency' I like that one :). There are some that it doesn't really apply (which makes authors life easier) but what about the rest?
N/A = 8
Yes = 5
No = 7
Mhhhhhhhh.
N/A = 8
Yes = 5
No = 7
Mhhhhhhhh.
14/ And now let's switch into the 'not so objective' one, which is certainty of the evidence. In here we can find that 19 out of 20 have low or very low certainty.
Very Low = 6
Low = 13
Moderate = 1
Very Low = 6
Low = 13
Moderate = 1
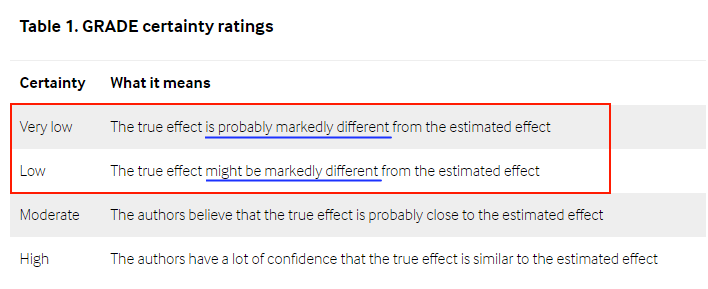
15/ Now let me translate what it means to have 'low certainty' in the evidence. This Table comes from Gordon himself ( https://en.wikipedia.org/wiki/Gordon_Guyatt) and available at https://bestpractice.bmj.com/info/toolkit/learn-ebm/what-is-grade/
16/ What is it telling us? The authors themselves rate the evidence that the 'true effect' (what it is reported) 'might or is' probably MARKEDLY DIFFERENT from what the study itself claims for 19 out of 20. Let that sink in!!!
17/ Probably at this rate you would say: Good Job!! We are done. BUT NO!!! There is more :) but I will leave that for tomorrow as today it is already 2AM. If you find it interesting already, make sure to retweet it so other will have the chance to read it https://twitter.com/federicolois/status/1361902737265471491

 Read on Twitter


