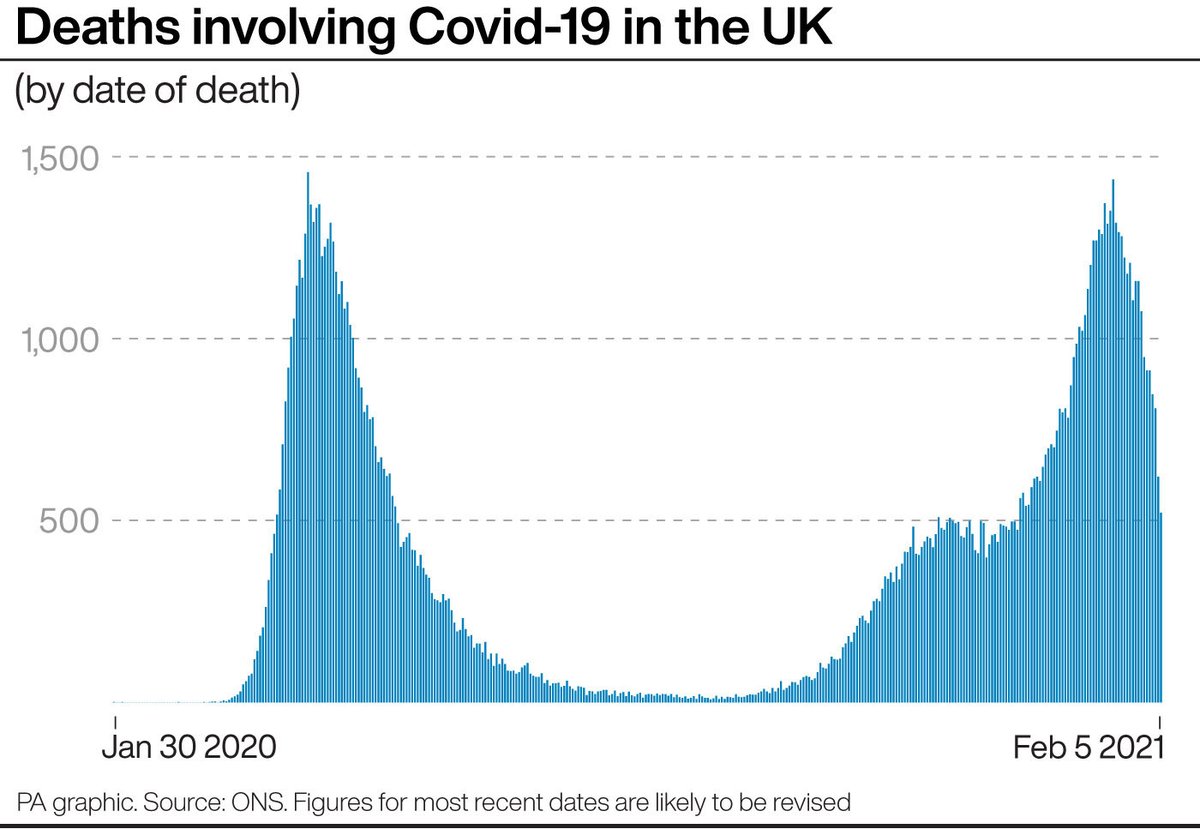
The latest ONS data gives the fullest picture yet of how the second wave of Covid-19 has unfolded.
Last week I said I thought January 19 was looking like the peak of the second wave. The new figures confirm this, with 1,437 deaths occurring on that date.
Last week I said I thought January 19 was looking like the peak of the second wave. The new figures confirm this, with 1,437 deaths occurring on that date.
1,437 deaths on January 19 is only slightly below the peak recorded during the first wave of the virus, when 1,457 deaths occurred on April 8 2020.
There were 23 consecutive days in January - from January 7 to 29 - when the daily death toll was above 1,000.
This mirrors exactly the number during the first wave, when 23 consecutive days of more than 1,000 deaths were recorded from April 2 to 24.
This mirrors exactly the number during the first wave, when 23 consecutive days of more than 1,000 deaths were recorded from April 2 to 24.
We now have daily data for both measures of cumulative Covid-19 UK deaths up to February 5 - just over a year since the first death took place.
Both lines are beginning to show a slight easing in the steepness of the curve.
Both lines are beginning to show a slight easing in the steepness of the curve.
It took 42 days for the death toll (based on death certificates) to rise from 75,000 to 100,000, and 20 days for it to rise from 100,000 to 125,000.
There's no consensus about when precisely the first wave ended and the second began.
But using Aug 31/Sep 1 for the purposes of illustration, 57,669 deaths took place in the first wave, while 75,408 deaths have so far taken place in the second wave.
But using Aug 31/Sep 1 for the purposes of illustration, 57,669 deaths took place in the first wave, while 75,408 deaths have so far taken place in the second wave.

 Read on Twitter


