A new series to introduce the autocorrelation function (ACF) w/ time series data, with special thanks to @robjhyndman for feedback & suggestions! 
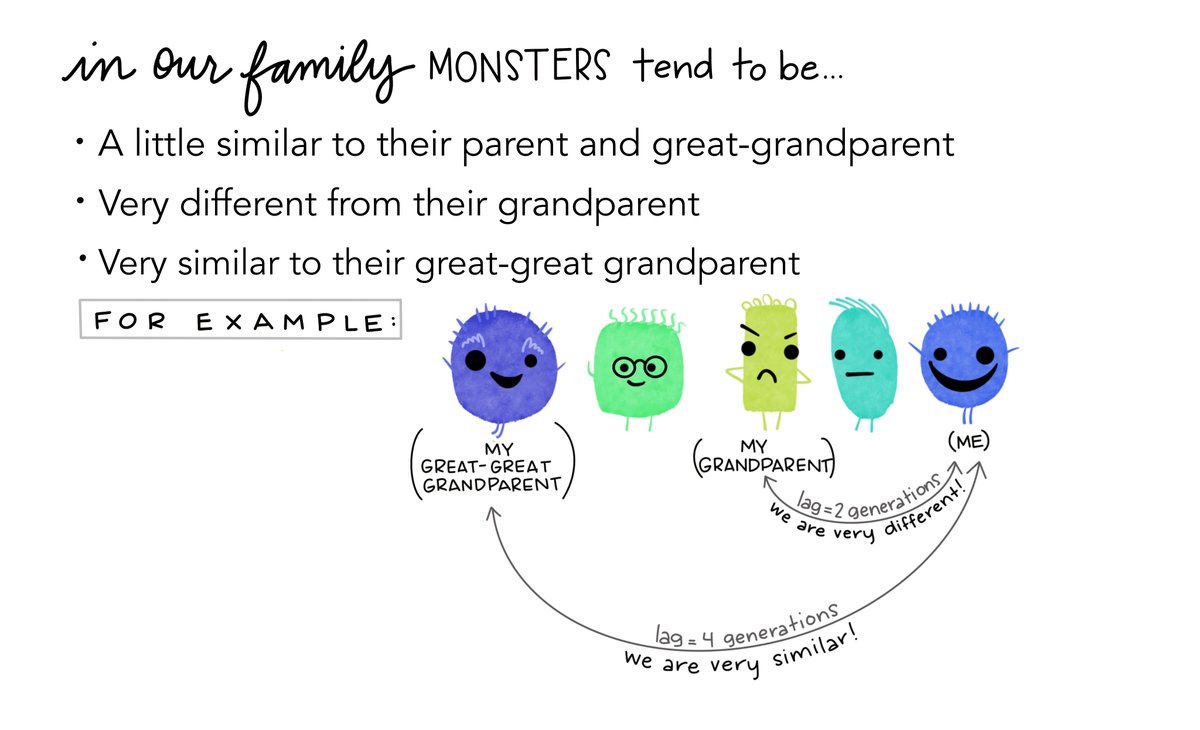
 1/9: Meet the monster family. The youngest generation is on the right (that's our host).

 1/9: Meet the monster family. The youngest generation is on the right (that's our host).
 2/9: There are some notable patterns in similarities between monsters separated by different numbers of generations...for example, in this family, monsters tend to be very similar to their great-great grandparents, but very different from their grandparents...
 3/9: Let's start with a blank graph area & start building the ACF by finding the correlation between monsters separated by different time lags (in our case, generations, shown on the x-axis).
 4/9: First find the correlation between each monster and it's parent (lag = 1 generation). They are slightly similar (the ACF is slightly positive).
 5/9: Cool now do the same thing at lag = 2 (correlation between monsters & and their grandparent). They tend to be pretty different.
 6/9: At lag = 3, we find the correlation between monsters and their *great grandparent*, and find a slight positive correlation.
 7/9: Then we get to lag = 4, finding the correlation between monsters and their *great great grandparent* - in this family, they are highly positively correlated!
 8/9: And we can continue finding correlations between each monster and those that came before them (e.g. with their great great great grandparent & beyond)!
 9/9: In summary, the ACF shows us the correlation between observations (like monsters in my family) and those that came before them, separated by varied lags (here, monster generations).
 End.

 Read on Twitter


