As you do, I spent some time over the weekend analysing what are the biggest drivers of the #GAW share price.
@steveclapham convincingly recommends this kind of analysis in his recent book. He says that while looking at share price charts as any kind of predictor of the future..
@steveclapham convincingly recommends this kind of analysis in his recent book. He says that while looking at share price charts as any kind of predictor of the future..
has a bad rap, it can at minimum tell you a lot about what the market is thinking. He’s surely right about that.
To start with, I took the CORREL function in Excel and compared the share price (averaged over a month) to a lot of metrics from their H1 and H2 releases every Jan...
To start with, I took the CORREL function in Excel and compared the share price (averaged over a month) to a lot of metrics from their H1 and H2 releases every Jan...
and Jul, going back quite some years.
Obviously P/E correlates well with the share price. But that measure includes the share price - the very thing I am trying to predict.
Removing measures that include the share price indicates that free cash flow really is vital, whether ...
Obviously P/E correlates well with the share price. But that measure includes the share price - the very thing I am trying to predict.
Removing measures that include the share price indicates that free cash flow really is vital, whether ...
you try figures from the P&L, balance sheet or cash flow statements. (If you have found a better one, let me know!)
This should not be very surprising – FCF is a key metric for investors. To be fair, measures of earnings also work well (partly because GAW is so good at ...
This should not be very surprising – FCF is a key metric for investors. To be fair, measures of earnings also work well (partly because GAW is so good at ...
converting profits into cash). But FCF works even better.
If I have got my Excel formulas right, the most recent H1 or H2 free cash flow correlates 0.90 with the share price. Include the two most recent H1/H2s and it is 0.92.
If I have got my Excel formulas right, the most recent H1 or H2 free cash flow correlates 0.90 with the share price. Include the two most recent H1/H2s and it is 0.92.
Does that mean we can gauge when the share is undervalued by looking at price to the previous year’s free cash flow?
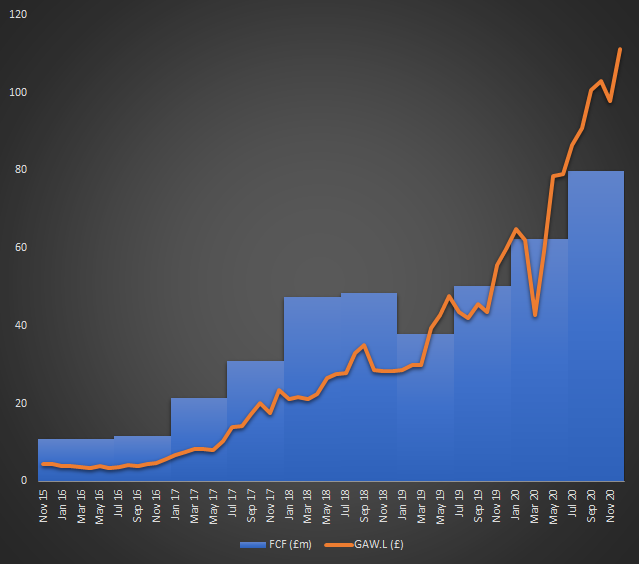
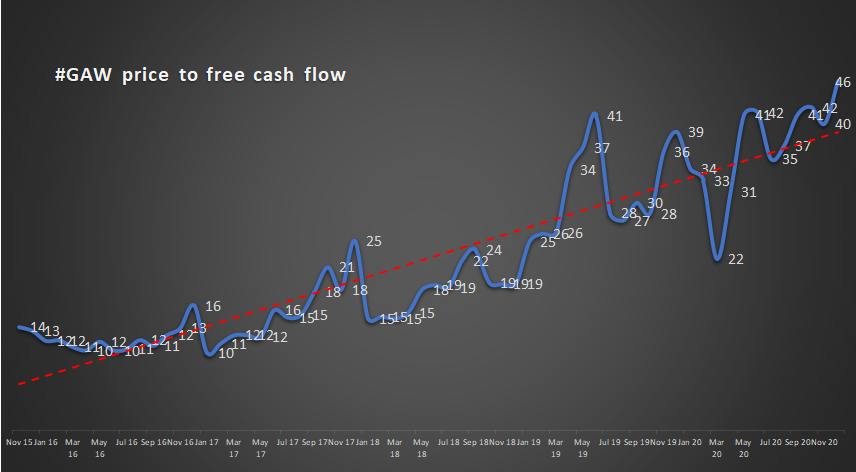
This chart shows the same broad upward trend as the orange line above.
But accounting for cash flow also does a lot to ahem … flatten the curve, as they say. Control for FCF, and the share price rise is not so startling.
But accounting for cash flow also does a lot to ahem … flatten the curve, as they say. Control for FCF, and the share price rise is not so startling.
This is exactly what we would expect if we think FCF is the key driver.
This second chart also identifies a number of times when the share price moved noticeably out of line with the normal trend.
A case that is far from obvious in the first chart is Apr to Jun of 2019...
This second chart also identifies a number of times when the share price moved noticeably out of line with the normal trend.
A case that is far from obvious in the first chart is Apr to Jun of 2019...
when the P/FCF soared – only to revert dramatically to type. But as the price chart shows, this was far more about a rise in FCF in July than a fall in the share price. And by the end of 2019, the P/FCF was back to a lofty 39.
It then dipped dramatically in Mar 2020, and...
It then dipped dramatically in Mar 2020, and...
recovered very fast. But comparing the charts suggests the recovery was once again very much driven by positive FCF news in July.
None of this is earth-shattering: good fundamentals have driven share price growth.
None of this is earth-shattering: good fundamentals have driven share price growth.
This is probably reassuring for shareholders that we haven’t bought into a ludicrous bubble. But it is also pretty dog bites man.
So why have I topped up my position *again* today?
So why have I topped up my position *again* today?
It’s not because I think I can look into a crystal ball and predict future free cash flows with any confidence.
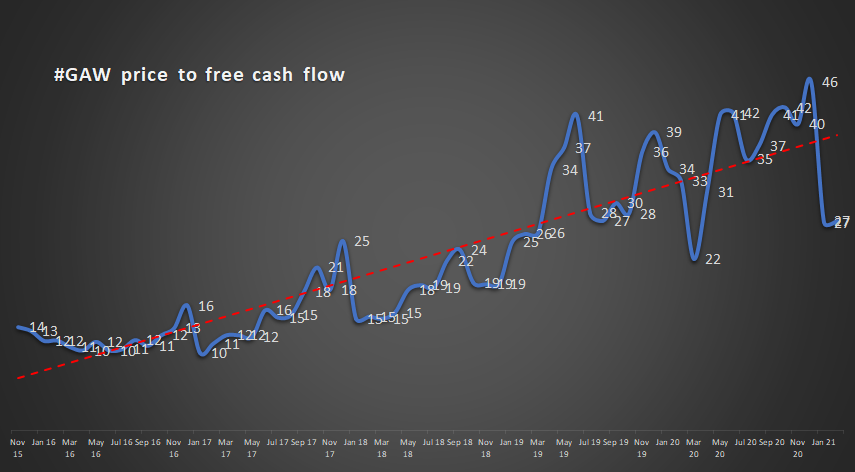
It’s because if you extend the above chart into February 2021, you get this:
It’s because if you extend the above chart into February 2021, you get this:
FCF of £74m (H2 2020 and H1 2021) compared to 2020 (H1&H2) FCF of £51m can do a lot to bring a price to free cash flow ratio down to earth.
Every time I look at GAW’s H1 2021 results, they seem more impressive. Yet the share price has been down ever since.
Every time I look at GAW’s H1 2021 results, they seem more impressive. Yet the share price has been down ever since.
All this only helps the price to FCF ratio further.
We might now see March 2020 as an obvious buying opportunity. But the change in valuation since Dec 2020 is arguably even more dramatic. Could we look back on early 2021 in a similar way?
We might now see March 2020 as an obvious buying opportunity. But the change in valuation since Dec 2020 is arguably even more dramatic. Could we look back on early 2021 in a similar way?
Maybe it’s just that the markets know something I don’t (and if so what?). But GAW looks like a great buy to me right now.
So I bought.
So I bought.

 Read on Twitter


