Isn't it interesting to see that the World Economic Forum ( @wef ) has put space on its agenda? But is the @wef looking into the space economy in the right way with thehelp of @BryceSpaceTech ? Let me start a discussion. 1/25 https://twitter.com/BryceSpaceTech/status/1359876354678874114
Despite a few oversimplifications (see picture), the report makes an interesting round-up of the important and diverse uses of space technologies. It is a good reminder of why we need space in a modern society. 2/25
But the report fails miserably in the economic dimension, pitching up for the nth time the terrible Global Space Economy assessment of 366B$. 3/25
So what is the problem with this figure? There are 3 main problems: 1) lack of consolidation, 2) data sources & segmentation, and 3) data relevance to space. Eventually the chart fails to represent the actual economic dynamics of space. 4/25
Problem 1: compiled but not consolidated. The figure adds revenue streams that are included one in the other. For example 'satellite manufacturing' revenues are the capex of 'satellite leasing' because the operators buy the satellites - please consolidate, don't add. 5/25
Identically, 'launch' revenues are expenditures of the satellite operators, that procure and launch the satellites, they should be consolidated with 'satellite leasing' not added on top of it - please consolidate don't add. 6/25
Similarly, 'satellite leasing' revenues are the expenditures required for the 'consumer services' revenues, because media broadcasters lease the satellite capacity - please consolidate, don't add. 7/25
So, If you properly consolidate revenues you should eliminate at least 50B$ of double counts from the total presented here. 8/25
Problem 2: Data sources and segmentation. The data accumulated by Bryce mixes up a variety of sources and methodologies, and brings them all together without a question for the methodological validity of the approach. 9/25
For instance: Government Budgets is one big lump. The fact that these budgets are used to procure launch services and satellites is ignored, and is inconsistent with the presence elsewhere in the chart of these categories. This is clearly misleading. 10/25
With this in mind we are led to assume that 'satellte manufacturing' and 'launch' are only driven by commercial programmes (if so I'd be questioning these values too!). But when we look at launch statistics we know that is not true. 11/25
In 2019, only 20% of the mass launched in space (and the associated launch services) was commercially driven. All the rest was for government programmes. 12/25
The problem of quantifying these government programmes correctly is that for 2 of the 5 key players the information is simply not available: the Chinese and Russian space budgets are very badly documented. And if they were, their translation into dollars would be a problem 13/25
In my opinion, the government budget figure fails to properly reflect the massive investment of China (first launch power in 2019), and to a lesser extent, of Russia. It is vastly underestimated in that respect, by at least 40B$. 14/25
Problem 3: data relevance to space. The two largest figures included in this representation are 'consumer services' and 'Navigation, positioning, timing'. Let's look at consumer services first. 15/25
Problem 3.1: What are these consumer services? They are mostly composed of the subscriber revenue for pay TV (and radio) delivered by satellite. This is the value of multimedia content sold, and has no direct relevance to space. 16/25
Furthermore, if you consider that 80% of satellite TV broadcast is free to air you may wonder why pay TV distributed by satellite is included in the 'space economy' figure, and not free TV? 17/25
So, with this figure, Bryce is including in the space economy about 100B$ of multimedia content produced on Earth, only because it was delivered by satellite. It is an interesting figure, but does it have any relationship with space? 18/25
To put it in a different perspective, would you assess the transport economy by the value of goods transported or by the value of the transporter service? Satellite operators are not charging more based on the value of the multimedia content, the two figures are unrelated. 19/25
Then, I would recommend to remove these 100B$ from the total and only count the value of the delivery service ('leasing'). 20/25
Problem 3.2: 'Navigation positioning Timing' - This figure is mostly composed of the value of GNSS receivers, inlcuding standalone receivers (e.g Garmin) and the chipsets we have in our smartphones, cars, fitbits etc. 21/25
The interesting fact is that this market is unrelated to the space infrastructure, but has its own dynamics. The growth of terminal numbers has no impact on the satellite infrastructure. Of course without the GNSS infrastrcture this maket would not exist. 22/25
So, this is 100B$ worth of terminals and consumer equipment, but why is Brycing labelling it 'satellite industry' in the chart? 23/25
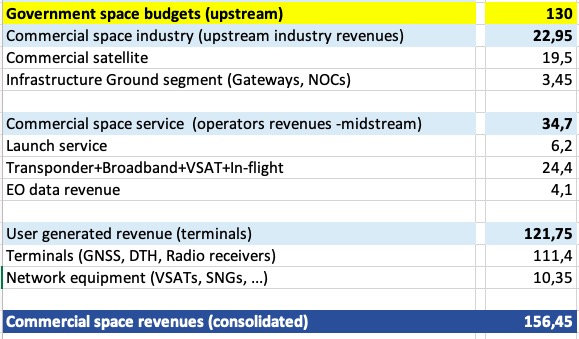
So what would it look like if it were done differently? I have applied my logic to the @BryceSpaceTech data sets, and produced the following table. The global space economy would represent about 285 B$, of which 45% are government budgets and 43% are consumer terminals. 24/25
So the 'real' space economy, i.e. the economic activity driven by the development and production of space infrastructure, is worth 153 B$, with 85% of it being driven by government programmes. 25/End
@threader_app compile

 Read on Twitter

