2/ Successful marketplace businesses unlock money to their supply-side participants.
For AMMs, this means that LPs expect to get back more than their initial deposit.
To determine the long-term viability of an AMM, we need tools that tell us how likely that is to happen.
For AMMs, this means that LPs expect to get back more than their initial deposit.
To determine the long-term viability of an AMM, we need tools that tell us how likely that is to happen.
3/ Quantifying & comparing the performance of AMMs:
In our new AMM dashboard, we’ve initially settled on two simple performance indicators that tell us about an AMMs
a) capital efficiency
b) financial performance https://terminal.tokenterminal.com/dashboard/AMMs
In our new AMM dashboard, we’ve initially settled on two simple performance indicators that tell us about an AMMs
a) capital efficiency
b) financial performance https://terminal.tokenterminal.com/dashboard/AMMs
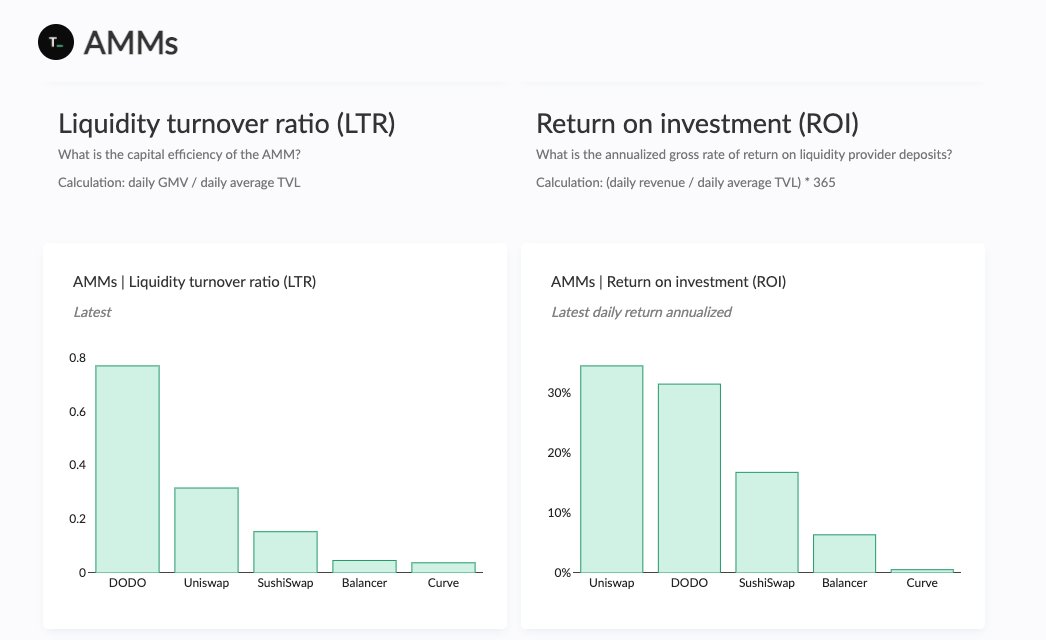
4/ Liquidity turnover ratio (LTR):
What is the trading volume generated per $ of liquidity provisioned?
Calculation: daily GMV / daily average TVL.
The higher the LTR, the better the capital efficiency.
What is the trading volume generated per $ of liquidity provisioned?
Calculation: daily GMV / daily average TVL.
The higher the LTR, the better the capital efficiency.
5/ Return on investment (ROI):
What is the gross rate of return generated per $ of liquidity provisioned?
Calculation: (daily Revenue / daily average TVL) * 365.
The higher the ROI, the better the financial performance.
What is the gross rate of return generated per $ of liquidity provisioned?
Calculation: (daily Revenue / daily average TVL) * 365.
The higher the ROI, the better the financial performance.
6/ Definitions:
TVL = liquidity provisioned
GMV = trading volume generated
Revenue = total trading fees paid
TVL = liquidity provisioned
GMV = trading volume generated
Revenue = total trading fees paid
7/ Cumulative GMV & Revenue figures for AMMs:
Uniswap is a clear leader in terms of absolute GMV and Revenue.
Uniswap is a clear leader in terms of absolute GMV and Revenue.
8/ Latest LTR & ROI figures for AMMs:
DODO performs well on both LTR and ROI, although at a much lower scale than its competitors.
DODO performs well on both LTR and ROI, although at a much lower scale than its competitors.
9/ Uniswap’s historical LTR and ROI figures:
- Latest LTR: 0.32x
- Latest ROI: 34.53%
Uniswap has been able to consistently maintain a high LTR and ROI.
- Latest LTR: 0.32x
- Latest ROI: 34.53%
Uniswap has been able to consistently maintain a high LTR and ROI.
10/ SushiSwap’s historical LTR and ROI figures:
- Latest LTR: 0.15x
- Latest ROI: 16.78%
SushiSwap is at a clear second place after Uniswap, when accounting for scale.
- Latest LTR: 0.15x
- Latest ROI: 16.78%
SushiSwap is at a clear second place after Uniswap, when accounting for scale.
11/ Balancer’s historical LTR and ROI figures:
- Latest LTR: 0.05x
- Latest ROI: 6.37%
Balancer has not been able to reach similar levels of utilization and returns as its competitors.
- Latest LTR: 0.05x
- Latest ROI: 6.37%
Balancer has not been able to reach similar levels of utilization and returns as its competitors.
12/ Curve’s historical LTR and ROI figures:
- Latest LTR: 0.04x
- Latest ROI: 0.55%
Curve has not been able to reach similar levels of utilization and returns as its competitors.
- Latest LTR: 0.04x
- Latest ROI: 0.55%
Curve has not been able to reach similar levels of utilization and returns as its competitors.
13/ DODO’s historical LTR and ROI figures:
- Latest LTR: 0.77x
- Latest ROI: 31.50%
DODO performs well on both utilization and returns, although at a much lower scale than its competitors.
- Latest LTR: 0.77x
- Latest ROI: 31.50%
DODO performs well on both utilization and returns, although at a much lower scale than its competitors.
14/ Caveats for using LTR & ROI:
Token incentives may temporarily increase volumes and fees --> the above performance indicators should be viewed on a long-term basis.
Ratios should be evaluated against absolute figures, it's often harder to maintain performance at scale.
Token incentives may temporarily increase volumes and fees --> the above performance indicators should be viewed on a long-term basis.
Ratios should be evaluated against absolute figures, it's often harder to maintain performance at scale.
15/ For readers who want to learn more about the net returns of AMM deposits, we recommend checking out:
https://research.paradigm.xyz/uniswaps-alchemy.
https://research.paradigm.xyz/uniswaps-alchemy.
16/ Check out our newsletter for more DeFi-related insights: https://tokenterminal.substack.com/p/how-should-investors-assess-the-performance
fin/ To learn more about the metrics we use at Token Terminal, check out: https://docs.tokenterminal.com/

 Read on Twitter


