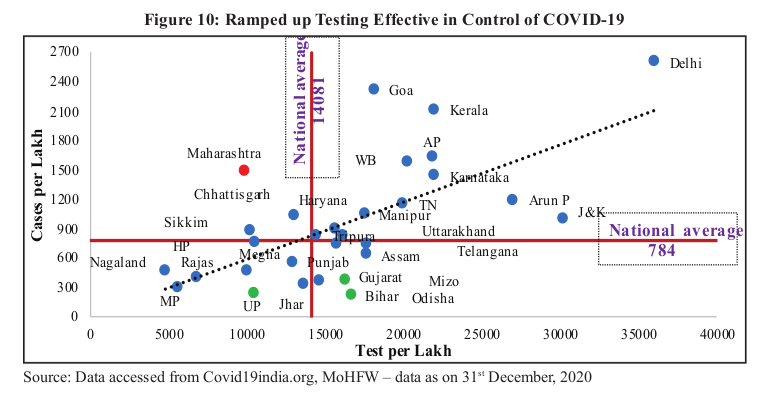
Another dubious claim in the Economic Survey 2020-21 backed up by a graph (Figure 10, Chapter 1). This claim is about testing. (With so many charts and graphs surely this document can't be full of nonsense?) #thread
The claim is that ramped up testing was "effective in control of COVID-19". We'd hope this is generally true.
Roughly, states below the dotted line have low "test positivity" - i.e., lots of tests, relatively few cases. UP, Bihar and Gujarat (green dots) are success stories.
Roughly, states below the dotted line have low "test positivity" - i.e., lots of tests, relatively few cases. UP, Bihar and Gujarat (green dots) are success stories.
First problem: the figure says little about "control of COVID-19" - unless there's a strong relationship between low test positivity and low spread. But, for example, the data says Kerala (high test positivity) has seen a much smaller % infected than Bihar (low test positivity).
How come? More testing is good, BUT how many cases you pick up depends on
- testing strategy (e.g., contact tracing or random testing?)
- the test used (more or less sensitive - RAT or RT-PCR)
- was testing happening in the right places at the right times? https://twitter.com/muradbanaji/status/1262798967261126656
- testing strategy (e.g., contact tracing or random testing?)
- the test used (more or less sensitive - RAT or RT-PCR)
- was testing happening in the right places at the right times? https://twitter.com/muradbanaji/status/1262798967261126656
What about Bihar? We know that it
- tested mostly after peak
- used mainly low sensitivity rapid antigen tests
- engaged in industrial scale dishonesty and manipulation around testing. https://indianexpress.com/article/express-exclusive/bihar-covid-testing-data-phc-coronavirus-cases-7183542/
- tested mostly after peak
- used mainly low sensitivity rapid antigen tests
- engaged in industrial scale dishonesty and manipulation around testing. https://indianexpress.com/article/express-exclusive/bihar-covid-testing-data-phc-coronavirus-cases-7183542/
Without similar investigation we don't know how much of this kind of manipulation happened in other "successful" states like UP and Gujarat.
But remember this from UP? The key point: the doctor had a "target" to meet, just as in Bihar. https://timesofindia.indiatimes.com/videos/city/lucknow/on-cam-mathura-doctor-gives-fake-samples-to-meet-covid-19-test-target/videoshow/78218083.cms
But remember this from UP? The key point: the doctor had a "target" to meet, just as in Bihar. https://timesofindia.indiatimes.com/videos/city/lucknow/on-cam-mathura-doctor-gives-fake-samples-to-meet-covid-19-test-target/videoshow/78218083.cms
Last May in this piece I touched on how central policy could be encouraging state governments to "manipulate data including finding ways to underreport Covid-19 infections and deaths". Those who did are now being rewarded. n/n https://scroll.in/article/962992/what-effects-has-the-lockdown-had-on-the-evolution-of-covid-19-in-india

 Read on Twitter


