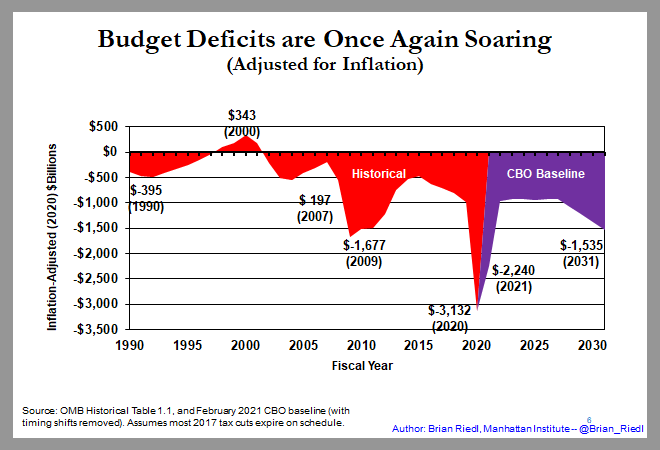
Chartstorm: Today, CBO released its new budget baseline. Here are actual and projected deficits:
2019: $984 billion
2020: $3,132 billion
2021: $2,258 billion plus any added relief legislation
2020-2031: $17,656 billion doubling the debt - plus new legislation. (1/)
2019: $984 billion
2020: $3,132 billion
2021: $2,258 billion plus any added relief legislation
2020-2031: $17,656 billion doubling the debt - plus new legislation. (1/)
Here are deficits over a longer period and adjusted for inflation. Note how huge the 2020-2031 deficits are compared to earlier. The Bush deficits don't look as calamitous anymore. (2/)
The debt as a share of GDP is set to surpass WWII levels. The difference is WWII ended and the debt ratio fell. This time around, annual deficits are projected to soar to 12.6% of GDP over 30 years due to Social Security and Medicare shortfalls of 14% of GDP. (3/)
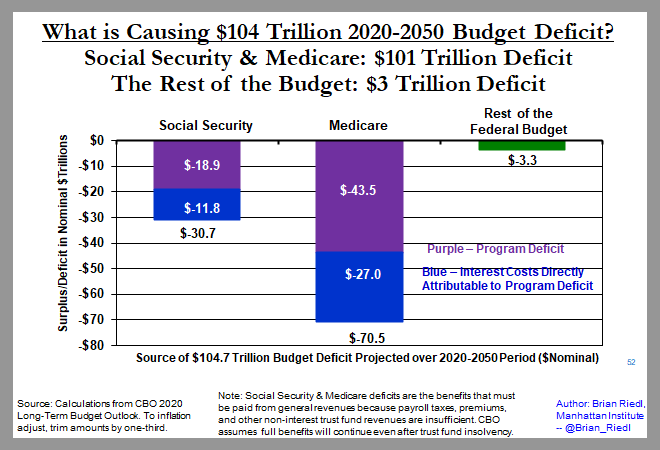
Clearly the moving variable is rising spending, rather than collapsing tax revenues. Pandemic spending now, but over the long-term it is Social Security, Medicare, and the resulting interest on the debt. (4/)
Deficits are soaring - even excluding the pandemic and recession costs - because the general revenue transfers into Social Security & Medicare that are needed to cover their growing shortfalls will leap by $1 trillion between 2019 and 2030. (6/)
Closing with a few long-term charts from 2020 CBO long-term baseline. This 195% is the rosy scenario of tax cuts expiring, no new pandemic (or other) spending, and modest interest rates. If rates rise by even 1% above the baseline, add $30 trillion & 70% of GDP to debt (8/)

 Read on Twitter


