New preprint with @RowlandKao @researcherjess and @GavrilAmadea! We estimate the proportion of #SARSCoV2 infections in England that get diagnosed with a positive test (1/13) ... https://www.medrxiv.org/content/10.1101/2021.02.09.21251411v1
Headline results:
Throughout 2020 the % of all infections being reported through Pillar 1 & 2 tests declined in the North but not in the South
Infection from the UK variant appears more likely to result in someone getting a positive diagnosis.
Here is a thread ... (2/13)
Throughout 2020 the % of all infections being reported through Pillar 1 & 2 tests declined in the North but not in the South
Infection from the UK variant appears more likely to result in someone getting a positive diagnosis.
Here is a thread ... (2/13)
There are a few reasons why someone who catches the virus might not get a positive diagnosis: they could be asymptomatic? maybe they don't want to know? maybe they do, but get a false negative? We wanted to know the proportion of those infected who *do* get a positive test (3/13)
We took case counts from the http://gov.uk dashboard, made some assumptions about test sensitivity and incubation times (papers by @HellewellJoel and @salauer_biostat), and applied basic probability theory to estimate the % of people with detectable #SARSCoV2 (4/13)
There's one parameter in this "model" we don't know: the proportion of infections that are eventually reported through Pillar 1 or 2 testing. We estimated this at various points in time by equating the model output with prevalence estimates from the @ONS infection survey (5/13)
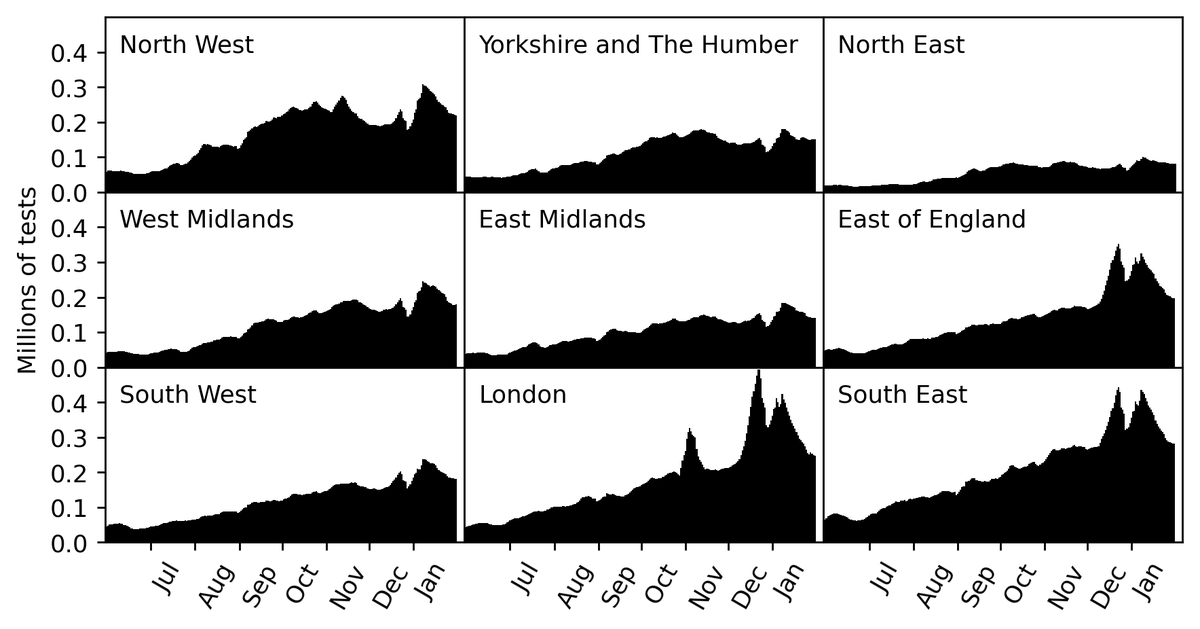
In the South the percentage of infections reported increased over time but in the North it was in decline for a while. Testing increased in all regions of England during this time - so that doesn't explain it. Could it be something to do with test-seeking incentives? (6/13)
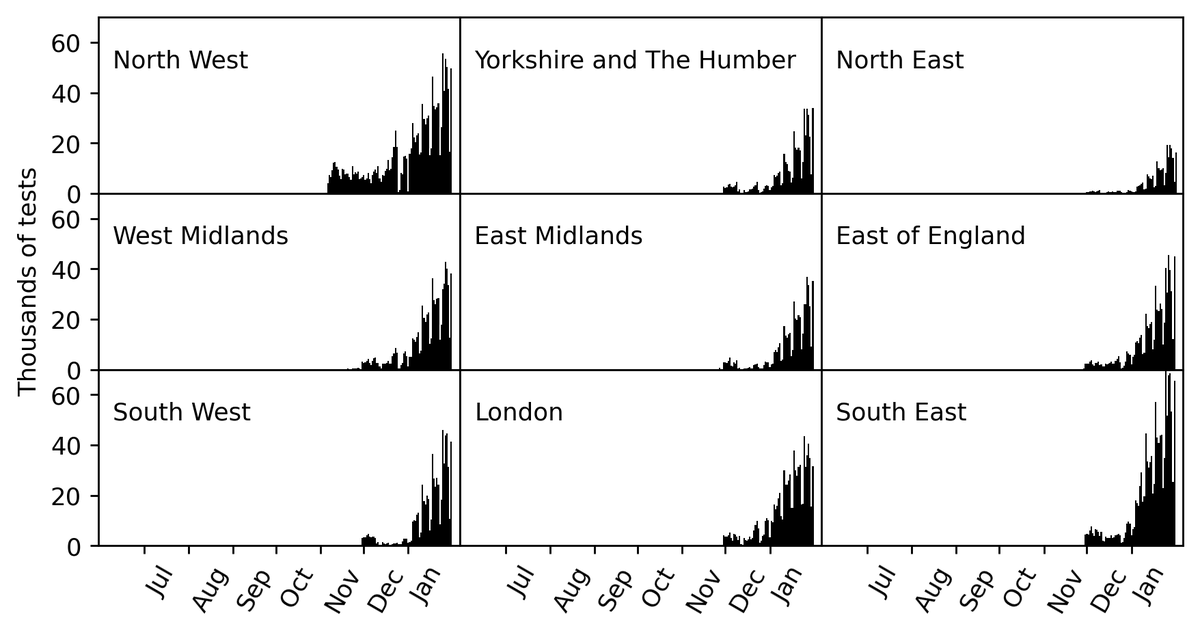
Starting in November, all regions saw a increase in the percentage of infections being reported. We thought that this might be due to the increase of lateral flow device testing and/or the new variant. The lateral flow device testing has sky-rocketted in recent months ... (7/13)
... but also the B.1.1.7 lineage a.k.a the UK variant a.k.a the VOC, which is already known a number of clinical differences, has become dominant ... (8/13)
Using our "model", we found good agreement with the ONS reported prevalence by assuming that the reporting rate is 25% for old variants and 32% for the new one. (the effect of LFD testing doesn't change our conclusion that the percentage is higher for the new variant) (9/13)
The agreement between our estimate based on Pillar 1 & 2 cases, and the ONS infection survey tends to be pretty good. It doesnt match quite as well for the last few data points, this reflects the fact that we don't really know what is going on with this new variant (10/13)
One place this might be relevant is in the @PHE_uk report that estimates the additional transmisibility of the VOC based on Pillar 2 tests and contact tracing. How much of the difference they find is caused by an increased reporting rate? (11/13)
Not saying their conclusion is wrong (it is just as likely that I am misinterpreting our own analysis) but I think it should be acknowledged that there are many factors at play here (12/13)
Thanks for reading this far! Since you seem to be interested in this work please send us feedback and suggestions. Finally, a disclaimer that none of this has gone through peer review (13/13)

 Read on Twitter


