It’s time to tell the Real Turnout Story of 2020, reprising my state-level voter file deep dives from 2016 and 2018. You can find those here: https://twitter.com/PatrickRuffini/moments
The first Real Turnout Story of the 2020 election begins with the general election in Georgia. I’ll go state by state as vote history for the general election is released. First, I’d like to explain what these threads will look like.
Throughout, I’ll be comparing turnout to expectations. “Expectations” is the pre-election @EchelonInsights turnout model. It’s one that got pegged overall national turnout to within 1M of the final number. Still, there are some surprises. https://medium.com/echelon-indicators/america-is-headed-for-record-turnout-heres-what-that-looks-like-3432deb9fe05
Both parties use turnout models to guide who they think will vote, and which groups will vote in which numbers.
The delta between what actually happened and the model is the stuff that mattered that we didn’t expect to matter before 11/4.
And there was quite a bit of it.
The delta between what actually happened and the model is the stuff that mattered that we didn’t expect to matter before 11/4.
And there was quite a bit of it.
Key turnout takeaways from Georgia in the November 2020 election:
 White suburban turnout surged way above expectations
 Black (and Hispanic) turnout was below expectations
 Trump’s white working class base turned out as expected, there was no “hidden Trump voter” in GA
 White suburban turnout surged way above expectations
 Black (and Hispanic) turnout was below expectations
 Trump’s white working class base turned out as expected, there was no “hidden Trump voter” in GA
Let’s dive in. While overall turnout was way up in GA, it was 98.0% of what we expected based on who was registered to vote on Election Day. The huge turnout bump was already baked into voter registration, and could have been higher.
With overall turnout at 98% of expectations, here’s how it broke down by party, with non-party voters segmented by race/education:
Dems 99.4%
GOP 98.8%
No party, White, higher education precincts 105.8%
No party, White, lower education precincts 98.1%
No party, Nonwhite 92.0%
Dems 99.4%
GOP 98.8%
No party, White, higher education precincts 105.8%
No party, White, lower education precincts 98.1%
No party, Nonwhite 92.0%
Of note: Any “hidden” Trump vote would be contained among non-party whites in low-education precincts. Their relative turnout score (98.1%) mirrors the state number (98.0%) almost exactly. At least in GA, there was no “hidden Trump voter.”
Here’s how turnout broke down by race (& Georgia has good race data on the file)
White 99.4%
Black 95.0%
Hispanic 90.9%
Asian 107.8%
Others 99.4%
(It appears Black turnout recovered in the runoff, watch for a future thread on this.)
White 99.4%
Black 95.0%
Hispanic 90.9%
Asian 107.8%
Others 99.4%
(It appears Black turnout recovered in the runoff, watch for a future thread on this.)
Men performed better on turnout than women, turning out at 98.9% of expectations vs. 97.1% for women.
This gap was largely driven by Black voters, where Black women turned out at 93.4% vs. Black men at 97.8%, a reversal of 2016 when Black male turnout was low.
This gap was largely driven by Black voters, where Black women turned out at 93.4% vs. Black men at 97.8%, a reversal of 2016 when Black male turnout was low.
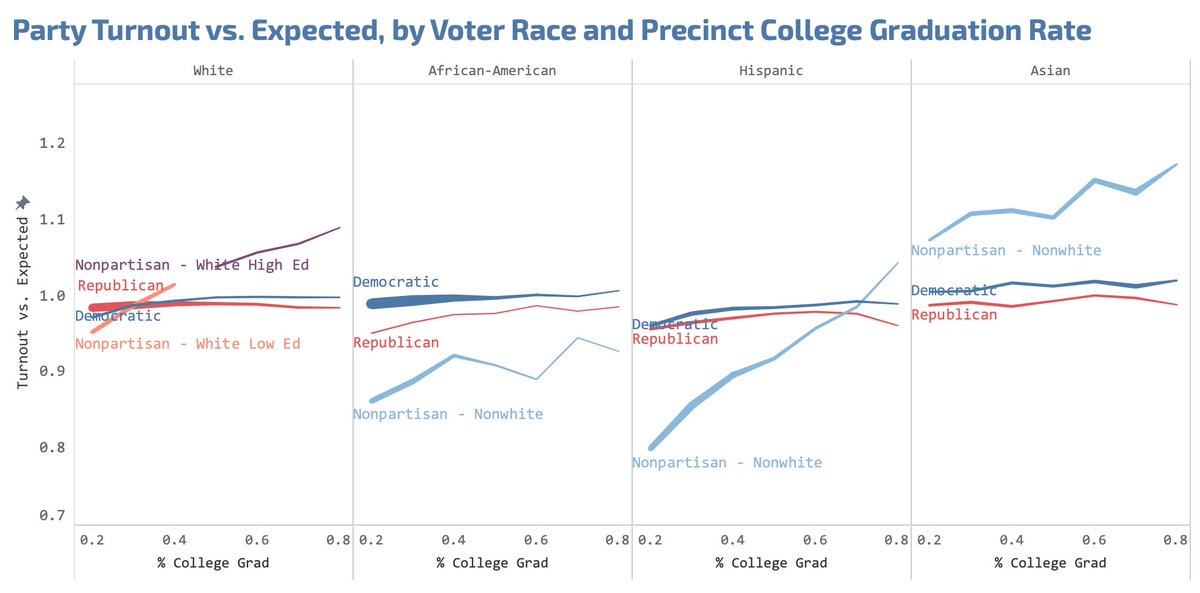
The more educated a precinct, the more turnout exceeded expectations. This was true of both white and nonwhite non-party voters. (Party voters don’t change that much because they’re primary voters whose turnout is already quite high.)
Among nonwhite groups, Democratic turnout was generally higher than that among the smaller number of Republicans. Black non-party turnout underperformed most. Again, precinct education is a *huge* driver of turnout performance.
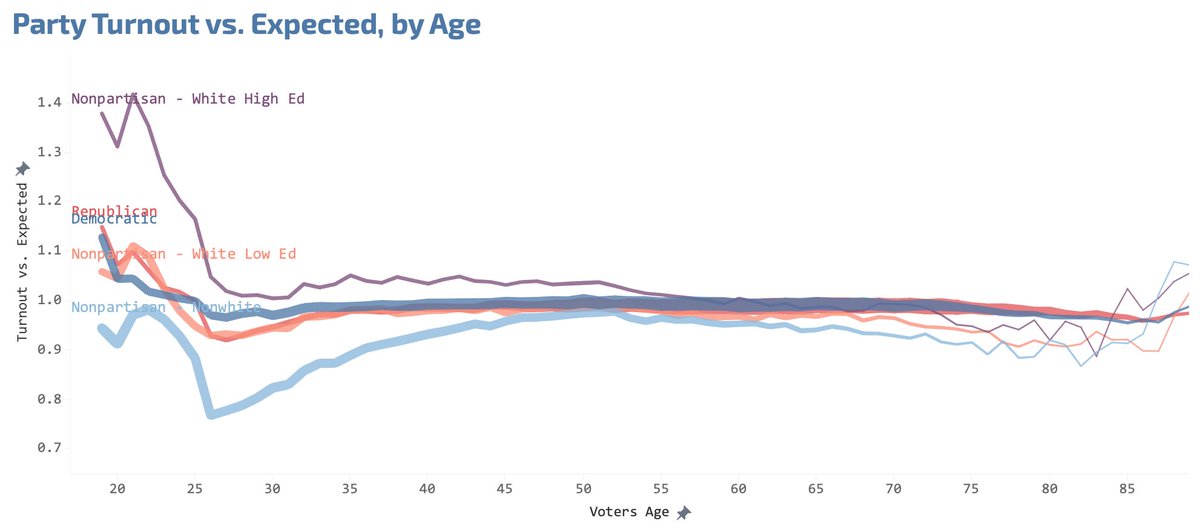
Turnout didn’t vary significantly across age but there were huge turnout gaps demographically among young voters, with young whites in educated precincts significantly overperforming and nonwhites underperforming.
Democrats and Democratic-leaning groups did slightly better than Republicans on turnout statewide, but did better on turnout in Atlanta suburbs which also swung strongly to Biden. New population growth, rather than relative turnout, explains more of the swing in these areas.
And here that is zoomed in on the Atlanta metro. Prosperous white suburbs to the north are colored blue, Black neighborhoods are colored red signifying relatively tepid Democratic turnout there.
Here is statewide map, also by Census block, showing turnout vs. ‘16. Switching to this metric for this since it’s a stark illustration of population growth. The strongest growth has been in Gwinnett, NE Atlanta suburbs, around Norcross and Lawrenceville.
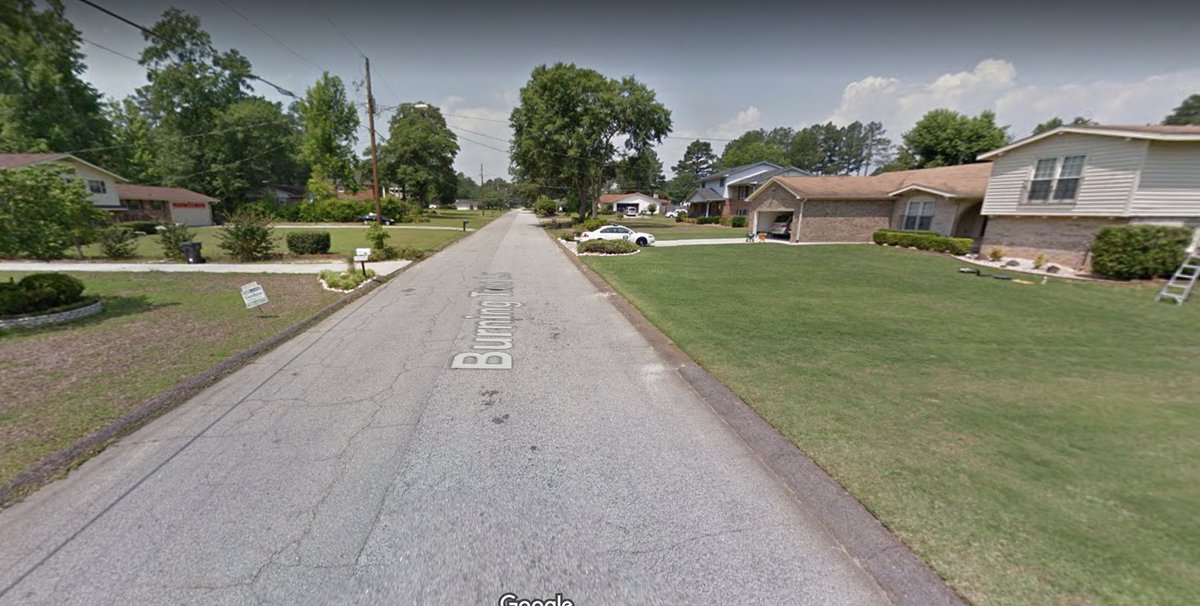
The most normal precinct in Georgia, based on weighted vote density and final result? It’s Precinct 808 in Richmond County, outside Augusta, GA.
 “The Real Turnout Story: Georgia 2020” https://twitter.com/i/moments/1359171034704998402

 Read on Twitter


