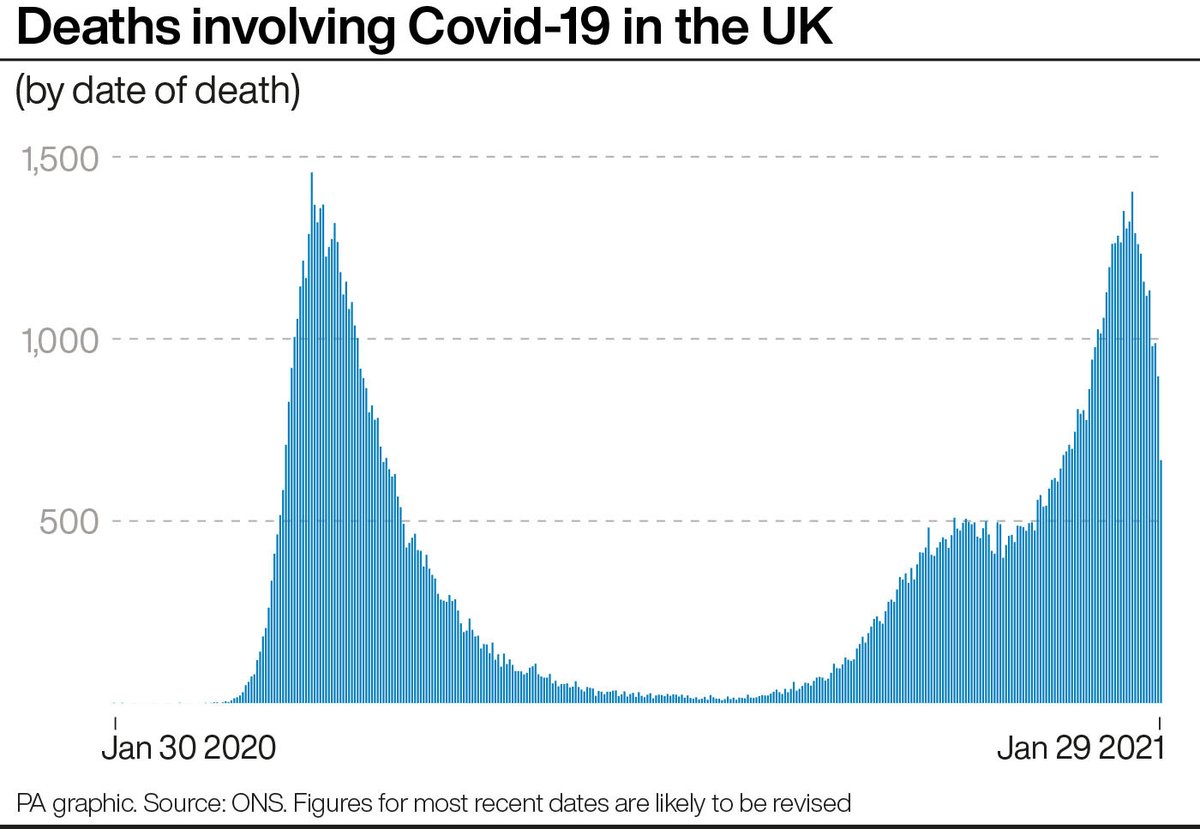
We now have daily data for both measures of cumulative Covid-19 UK deaths up to January 29 - almost exactly a year since the first death took place.
Both lines continue show a steepening curve in the most recent weeks.
Both lines continue show a steepening curve in the most recent weeks.
It took 42 days for the death toll (based on death certificates) to rise from 75,000 to 100,000, and 21 days for it to rise from 100,000 to 125,000.
It's looking like January 19 might have been when deaths in the second wave hit a peak.
The total for that day is currently 1,404 - though this (and other recent totals) are likely to be revised upwards once all deaths for this period have been registered.
The total for that day is currently 1,404 - though this (and other recent totals) are likely to be revised upwards once all deaths for this period have been registered.
Deaths peaked during the first wave on April 8, when 1,457 deaths occurred.
This remains the highest number of deaths on a single day since the pandemic began.
This remains the highest number of deaths on a single day since the pandemic began.
There's no consensus about when precisely the first wave ended and the second began.
But using Aug 31/Sep 1 for the purposes of illustration, 57,710 deaths took place in the first wave, while 68,313 deaths have so far taken place in the second wave.
But using Aug 31/Sep 1 for the purposes of illustration, 57,710 deaths took place in the first wave, while 68,313 deaths have so far taken place in the second wave.
My story on what the latest data on Covid-19 deaths can tell us. https://www.belfasttelegraph.co.uk/news/uk/latest-wave-of-covid-19-deaths-peaked-in-mid-january-figures-suggest-40069637.html

 Read on Twitter


