Last month's job report showed that women gained 87,000 jobs, but that their loss the month before was larger (-227,000) than initially thought.
It's hard to look at one month to gauge progress. Here's a long thread on women in the labor market to put today in context.
1/
It's hard to look at one month to gauge progress. Here's a long thread on women in the labor market to put today in context.
1/
There's two surveys we rely on for understanding the labor market: the establishment survey (of employers) which counts jobs and the households survey (of workers) which counts employed people. They don't match, because not all workers are someone's employee.
2/
2/
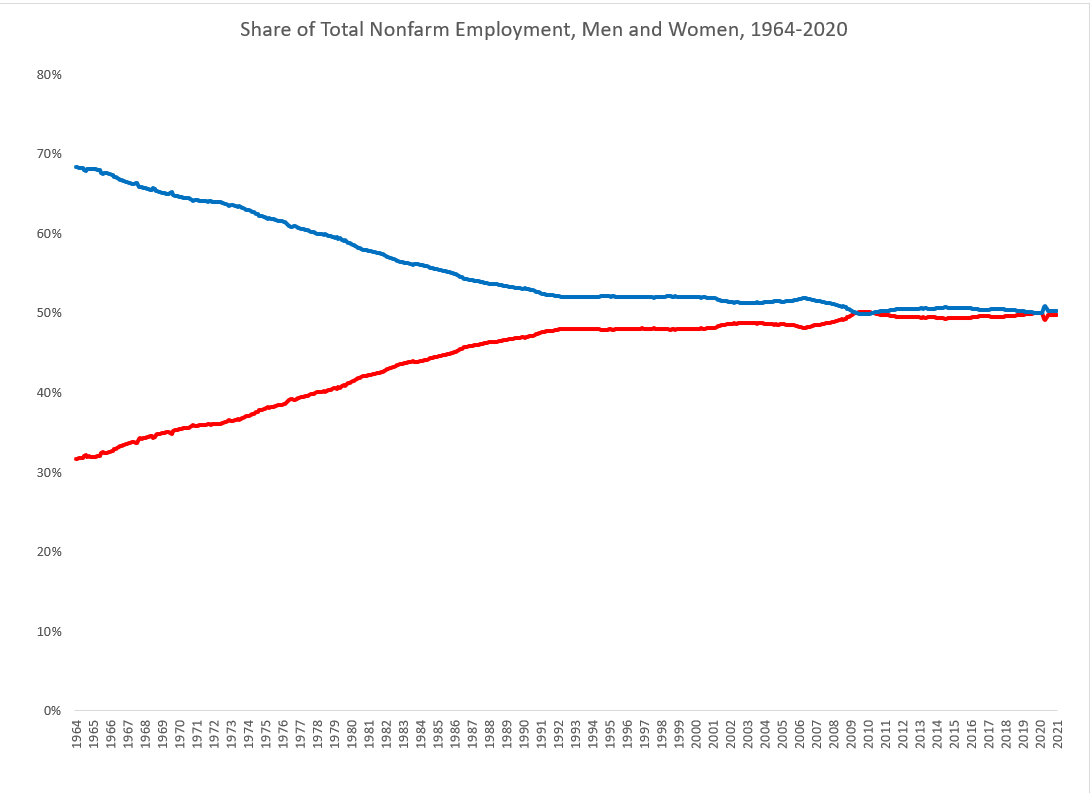
Let's start with jobs. The figure below shows the share of all jobs held by women and men since 1964. Women have been at near half of all employees for the past ten years.
3/
3/
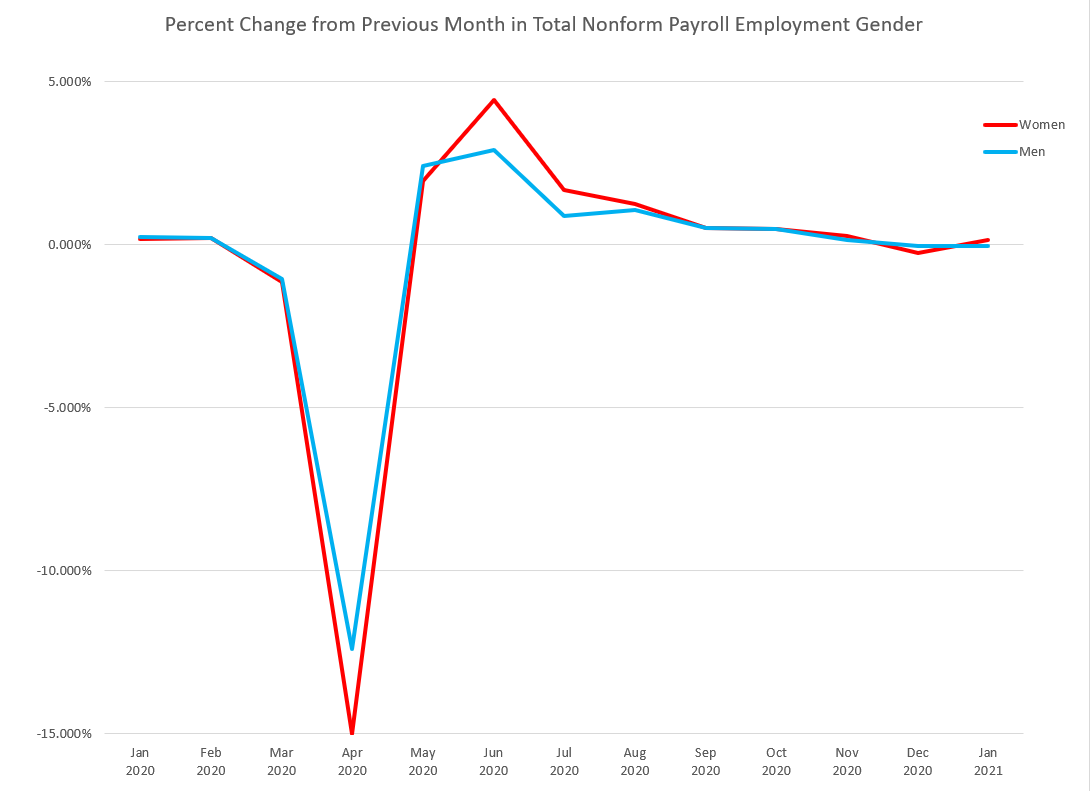
When the pandemic hit, women experienced much larger job loss. This figure shows the percent change in jobs from the prior month. In April, 15% of women's jobs from March were gone, compared to 12% for men.
4/
4/
Part of this is a composition story: women hold more jobs in industries highest hit. But that's true but not explanatory. Even within hard hit industries, women have lost more jobs. Here's total job loss by industry by gender:
5/
5/
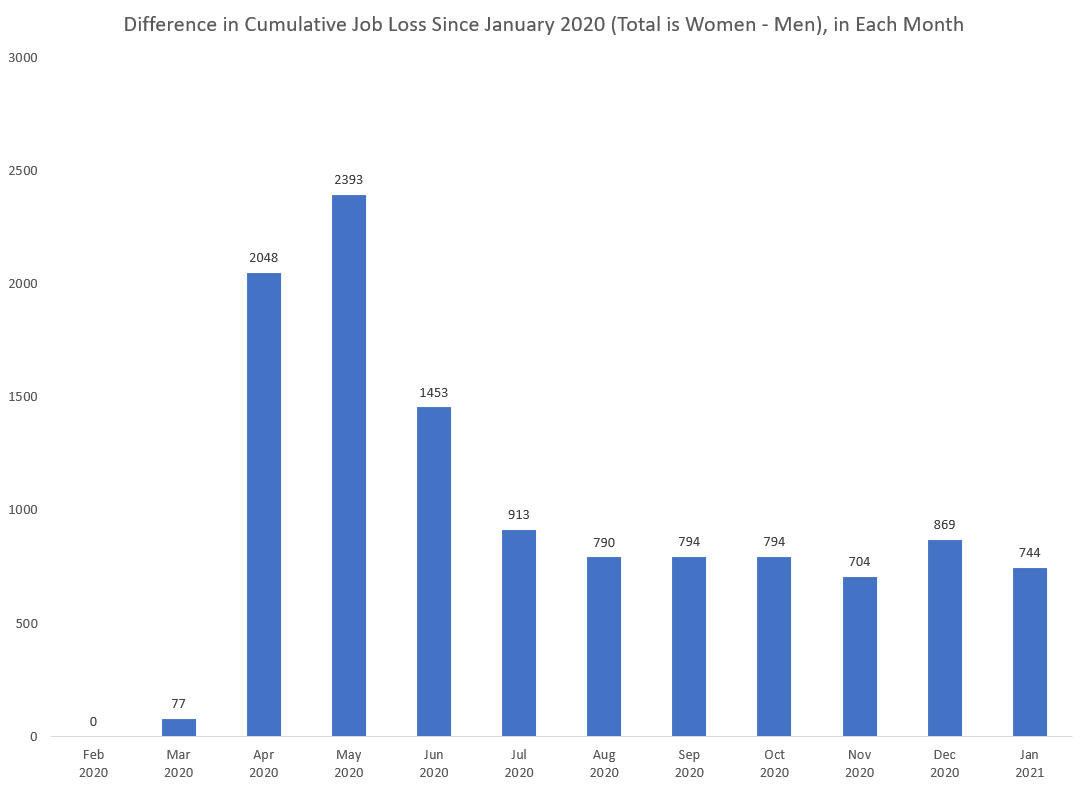
Rather than looking at single month changes in jobs, I look at the cumulative difference in job loss since the recession began.
Women lost more jobs than men, and have not made progress catching up to men since July.
6/
Women lost more jobs than men, and have not made progress catching up to men since July.
6/
Women have two job shortfalls right now.
1. They are down 5.3 million total jobs since the recession began (Feb 2020 - Jan 2021).
2. They are down 750,000 jobs relative to men (5.3 million compared to 4.6 million).
7/
1. They are down 5.3 million total jobs since the recession began (Feb 2020 - Jan 2021).
2. They are down 750,000 jobs relative to men (5.3 million compared to 4.6 million).
7/
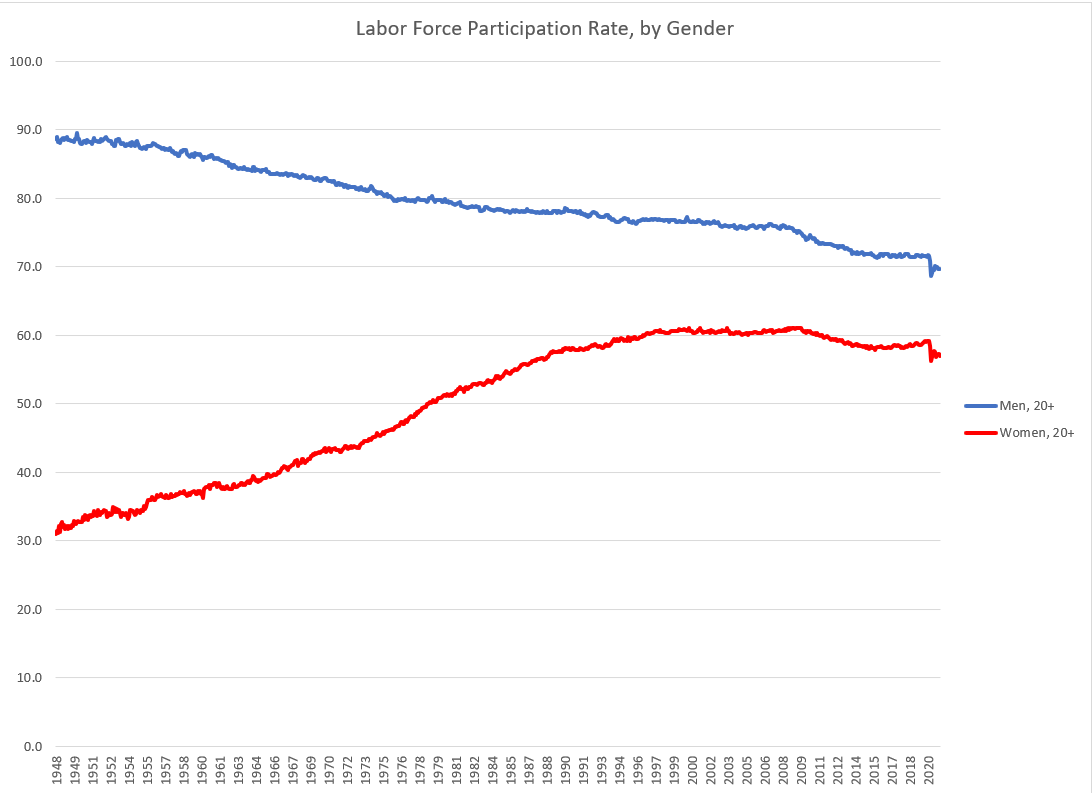
So that's jobs, and the establishment side. On the household side, we have labor force participation rate, which is the sum of people working and looking for work, as a share of the population.
Here's the participation rate by gender since 1948.
8/
Here's the participation rate by gender since 1948.
8/
Women's labor force participation doubled between 1950 and 1990, from 30% to 60% it has remained at about that level since 2000, while men's participation has been on a steady decline.
9/
9/
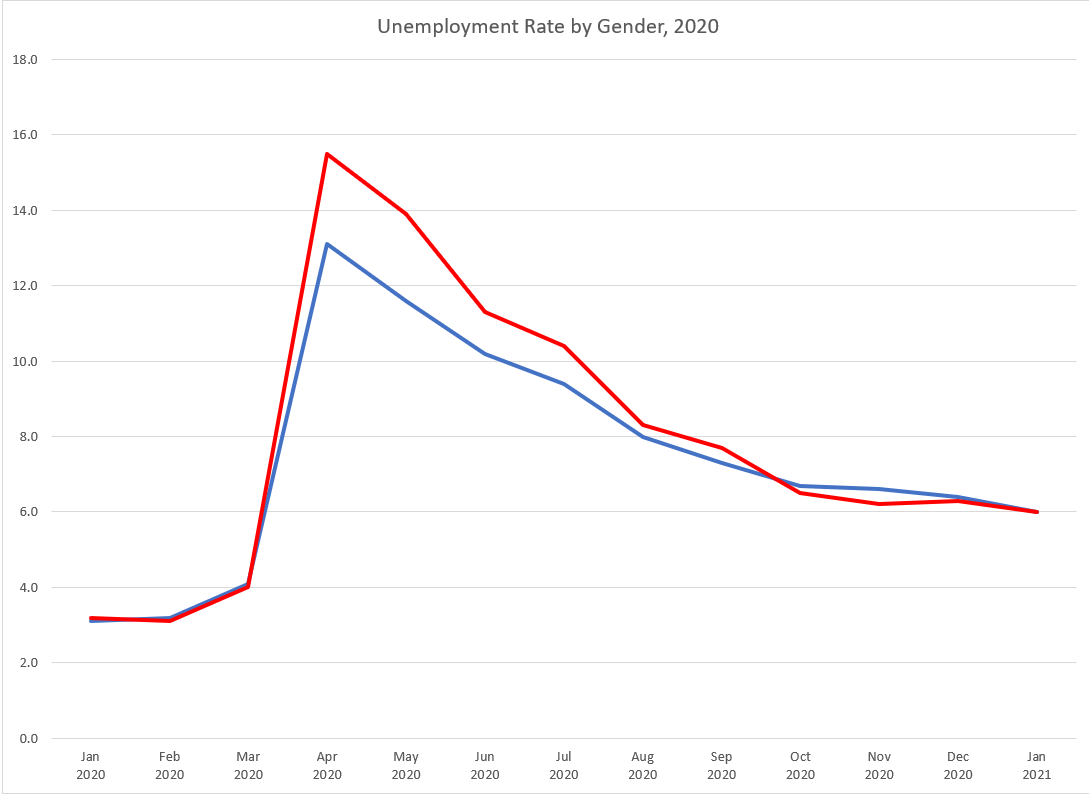
In the pandemic, not surprising given the larger job loss, women had higher unemployment rates. But the rates have evened up. Even though jobs are down for women, the unemployment rate is the same. This can be explained by women dropping out of the labor force.
10/
10/
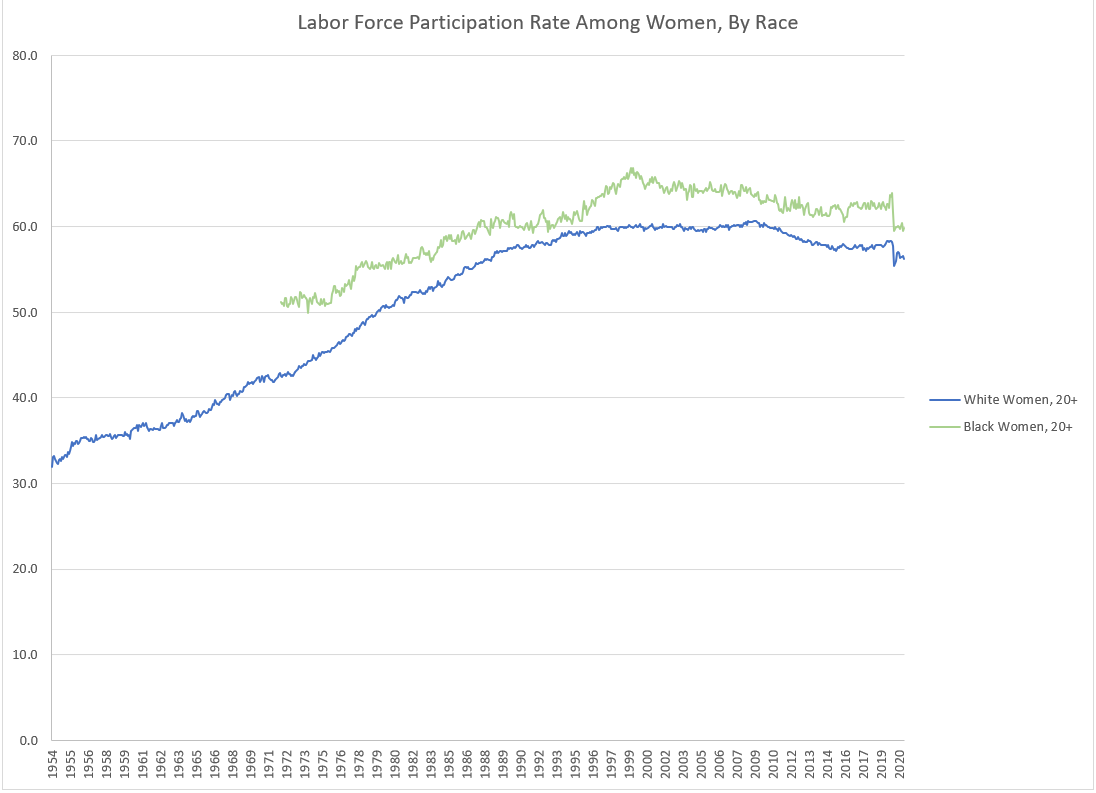
The household survey asks about demographic characteristics, allowing us to look at groups of women. To start, here's the labor force participation of black and white women since 1954.
Black women have always had higher participation than white women.
11/
Black women have always had higher participation than white women.
11/
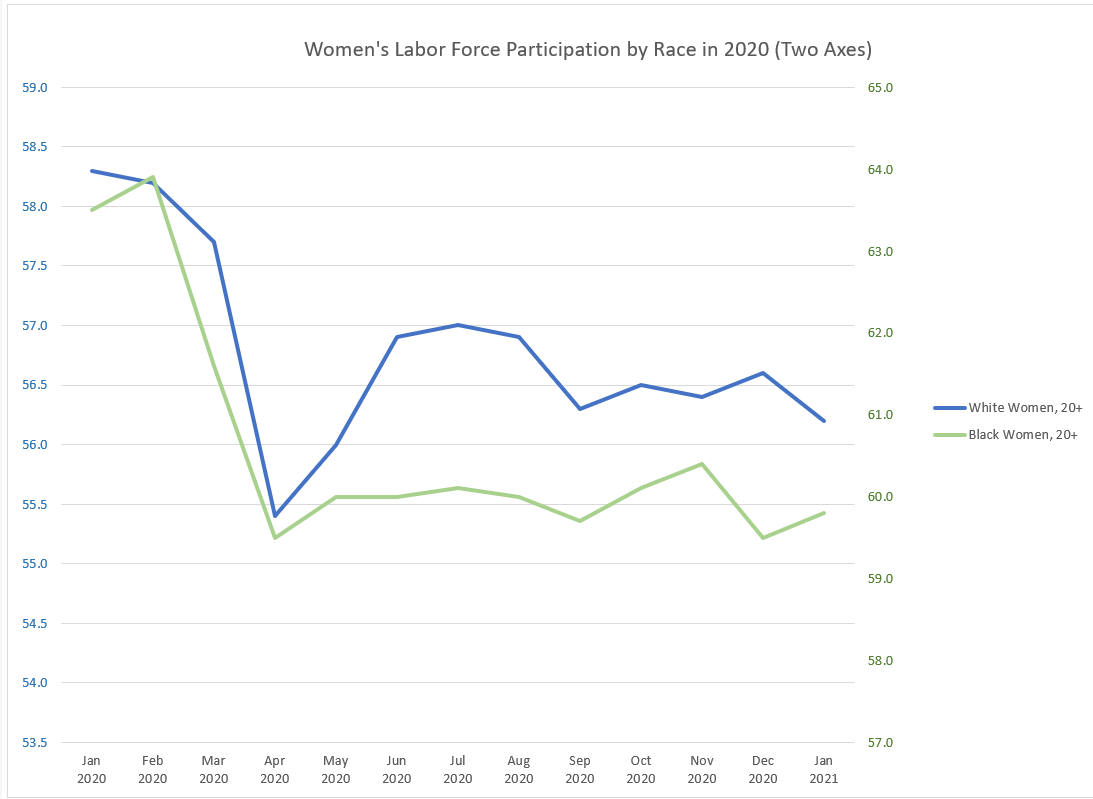
In the pandemic, though, black women's labor force participation has not started to recover, while white women's participation has shown small improvements.
This graph shows the rate by race for women on two axes, to show the shape of (non)recovery. No one is looking good.
12/
This graph shows the rate by race for women on two axes, to show the shape of (non)recovery. No one is looking good.
12/
And throughout the recession, the unemployment rate for black women has been higher than for white women.
13/
13/
The BLS does not produce monthly estimates of labor force statistics for Hispanic women, but we can expect that it would look similar to black women. That's because both black women and Hispanic women are disproportionately represented in the service occupations.
14/
14/
Services are health support (not practitioners), protective service, cleaning maintenance, food preparation and service, and personal care.
In 2019, 31% of Hispanic women and 27% of black women were in service occupations, compared to 20% for Asian and White women.
15/
In 2019, 31% of Hispanic women and 27% of black women were in service occupations, compared to 20% for Asian and White women.
15/
This CPS summary table as the occupation by gender and race.
https://www.bls.gov/cps/cpsaat10.htm
16/
https://www.bls.gov/cps/cpsaat10.htm
16/
So nearly a third of black and Hispanic women are in service occupations, and the unemployment rate for service occupations has been truly astronomical. It peaked at 27.2% and remains above ten percent.
Here's unemployment for the five major occupation groups:
17/
Here's unemployment for the five major occupation groups:
17/
In any recession, labor force participation declines. Some individuals who lose their job give up looking until the economy recovers. And given the extent of the job deficit, that's clearly a factor. But there's also the child care constraint.
18/
18/
The best research I've seen on this comes from the Minneapolis fed, which looks at participation by child age.
19/ https://www.minneapolisfed.org/article/2021/pandemic-pushes-mothers-of-young-children-out-of-the-labor-force
19/ https://www.minneapolisfed.org/article/2021/pandemic-pushes-mothers-of-young-children-out-of-the-labor-force
I have also looked at this for women who have children in the home (not necessarily mothers).
20/ https://www.rand.org/blog/2020/11/women-are-leaving-the-labor-force-in-record-numbers.html
20/ https://www.rand.org/blog/2020/11/women-are-leaving-the-labor-force-in-record-numbers.html
Keep in mind, labor force participation is how we are gauging the effect of child care constraints on women because it is clearly defined and measurable. But it's the extreme result, or the final result.
21/
21/
There are countless ways in which a woman can be affected by child care constraints and maintain a job still. Moving to part-time, scaling back ambition, giving up leadership, missing deadlines, missing promotions, getting demoted; we don't have the same accounting of those.
/n
/n
Sources: the establishment and household summary information is published monthly in the BLS employment situation (you can scroll to the bottom to see the links to specific tables or historical versions of those tables).
This is B-5 and A-2.
https://www.bls.gov/news.release/empsit.nr0.htm
This is B-5 and A-2.
https://www.bls.gov/news.release/empsit.nr0.htm
Adding to this thread because I misspoke! In 14, I said "The BLS does not produce monthly estimates of labor force statistics for Hispanic women" which is **VERY** wrong. I meant to reference the race/ethnicity overlap.
22/
22/
An important point on race and ethnicity: in the monthly data, they aren't mutually exclusive and exhaustive groups. Race includes ethnicity. So white and black labor force estimates includes Hispanic women of either race.
23/
23/
Here's the BLS definition:
Race
https://www.bls.gov/cps/definitions.htm#race
Hispanic
https://www.bls.gov/cps/definitions.htm#hispanic
What the BLS doesn't publish monthly is white, non-Hispanic and black, non-Hispanic. They publish white, black, and Hispanic and that latter is a subset of the former two.
24/
Race
https://www.bls.gov/cps/definitions.htm#race
Hispanic
https://www.bls.gov/cps/definitions.htm#hispanic
What the BLS doesn't publish monthly is white, non-Hispanic and black, non-Hispanic. They publish white, black, and Hispanic and that latter is a subset of the former two.
24/
So it's a little misleading to put all three together since they aren't describing separate populations.
With that caveat, here's labor force participation rates of women starting in 2003, the year BLS began publishing Hispanic women estimates monthly.
25/
With that caveat, here's labor force participation rates of women starting in 2003, the year BLS began publishing Hispanic women estimates monthly.
25/
In terms of women's labor force participation, the 2000s is "The Stall." The sustained increase of the prior decades leveled off.
Of course, until this recession and the pandemic, when they fell.
26/
Of course, until this recession and the pandemic, when they fell.
26/
To put all three groups together, I show the change in labor force participation rates from January of 2020. Everyone starts at zero.
All women decline, but black and Hispanic women have a larger drop than white women.
27/
All women decline, but black and Hispanic women have a larger drop than white women.
27/
I think that figure also makes clear how monthly changes need to be interpreted cautiously; they jump around a lot. What matters is the trend.
28/
28/
Finally, here's unemployment rate, but now with Hispanic women. Again, keep in mind that Hispanic women are included in black women and white women. So, if we were instead looking at white, non-Hispanic and black, non-Hispanic, their rates would be lower.
29/
29/
All of these figures put in context what's happening to women (apart from men) and what's happening to women of color (apart from white women).
Another element of this is to look at immigrant women. The BLS also publishes gender unemployment rates by nativity.
30/
Another element of this is to look at immigrant women. The BLS also publishes gender unemployment rates by nativity.
30/
In general, foreign-born women work less than native women. This makes sense, as immigrants have very different work access and restrictions.
This monthly series goes back to 2007.
31/
This monthly series goes back to 2007.
31/
Hopefully I won't have to continue to amend this thread because of a misstatement.

/n

/n

 Read on Twitter