I’ve been doing long-form threads breaking down statistical categories. Today I’m going to open it up and do a handful all at once because they’re all closely related. We’re looking at launch angle and how it corresponds to ground-ball rate, line drive rate, and fly ball rate.
Launch angle is one of the easiest stats to understand, it is simply the angle at which the ball comes off the bat. The visualization for the possible angles takes us back to our elementary school days using a protractor.
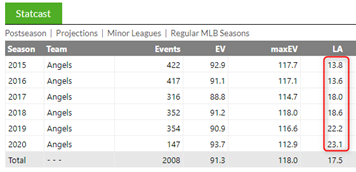
You will typically see this stat given as an average of all of a player’s batted balls. For example, if we look at Mike Trout’s @FanGraphs page, you will see one “LA” value for each season. This is the average launch angle.
The problem with that is that you can have a 23° average LA without ever hitting a ball at 23°. The average of -20 (probably a groundout) and 66 (probably a pop-out) is 23° (a line drive). So the 23 would make him look great despite the reality being two poorly-struck balls.
The only way to really get a grasp on a player’s launch angles is to view the full distribution. An example looks like this. Here we see that indeed, Trout’s most common LA is right around 23.
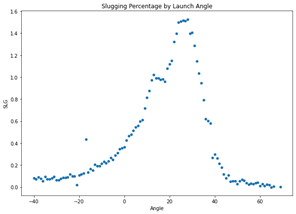
The reason we study launch angle is because it is one of the main drivers behind what outcome a batted ball achieves. We can show this by looking at the slugging percentage that each individual launch angle results in.
You can see from that visualization that most extra base hits come from angles between 10 and 30 or so. Looking at just home runs you can see that it’s very hard to homer with an angle outside of the 20 and 35 range.
Here is the same plot but using batting average instead of SLG. You can see the optimal range for just getting a hit is lower. The sweet spot is between 10 and 15. The leading angle is 13°, going for a hit 81.5% of the time the last two seasons.
This is where GB%, LD%, FB%, and IFFB% come into play. Those classifications are based on launch angles. Here is roughly how it works:
Here are the batting averages and slugging percentages for each classification. You see that most hits come from line drives, but extra-base hits come from fly-balls nearly as much as from line-drives.
This leads naturally to higher batting average coming from hitters with high line drive rates, and higher home run totals coming from hitters with lower ground ball and pop-up rates.
Here are the top ten line drive rates of the last six years with each player’s batting average alongside it. You notice that eight of the ten are very strong batting averages.
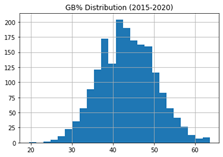
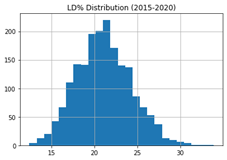
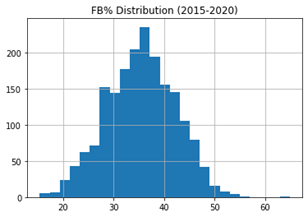
Now we’ll go through each of GB%, LD%, and FB% to point out what to consider high and what to consider low.
Keep in mind that these categories are using only plate appearances that end with a ball in play. So when you’re looking at a player page, their FB%, GB%, and LD% will always sum up to 100%.
This means that not all 50% fly-ball rates are created equal. Here is a player comparison (with made-up numbers) to consider.
Both players had the same number of PA’s and the same fly-ball rate, but player B generated 69 (I didn’t do this on purpose I swear) more fly-balls because of how many more balls he put in play after accounting for walks and strikeouts.
Joey Gallo of course comes to mind with his career 37.6% strikeout rate and 14% walk rate. That means he puts a ball in play in only around 48% of his plate appearances, making his high fly ball rate weigh much less than someone with average strikeout and walk rates.
In conclusion
-High LD% = high batting averages
-High GB% and PU% = low power output
-Homers come mainly (82% to be exact) from angles between 20° and 35°
-It’s important to keep in mind K% and BB% for context
-High LD% = high batting averages
-High GB% and PU% = low power output
-Homers come mainly (82% to be exact) from angles between 20° and 35°
-It’s important to keep in mind K% and BB% for context

 Read on Twitter
