Since it's a quiet Sunday morning here at the office, we wanted go into a little detail about something interesting we're seeing in the long term forecast. Follow along with us as you sip your morning coffee or tea (if you're into that sort of thing).
Here's our current high temperature forecast for this coming Saturday (2/13). Looking at this, you see that we're predicting highs near or slightly below normal for this time of year and probably don't think too much about it.
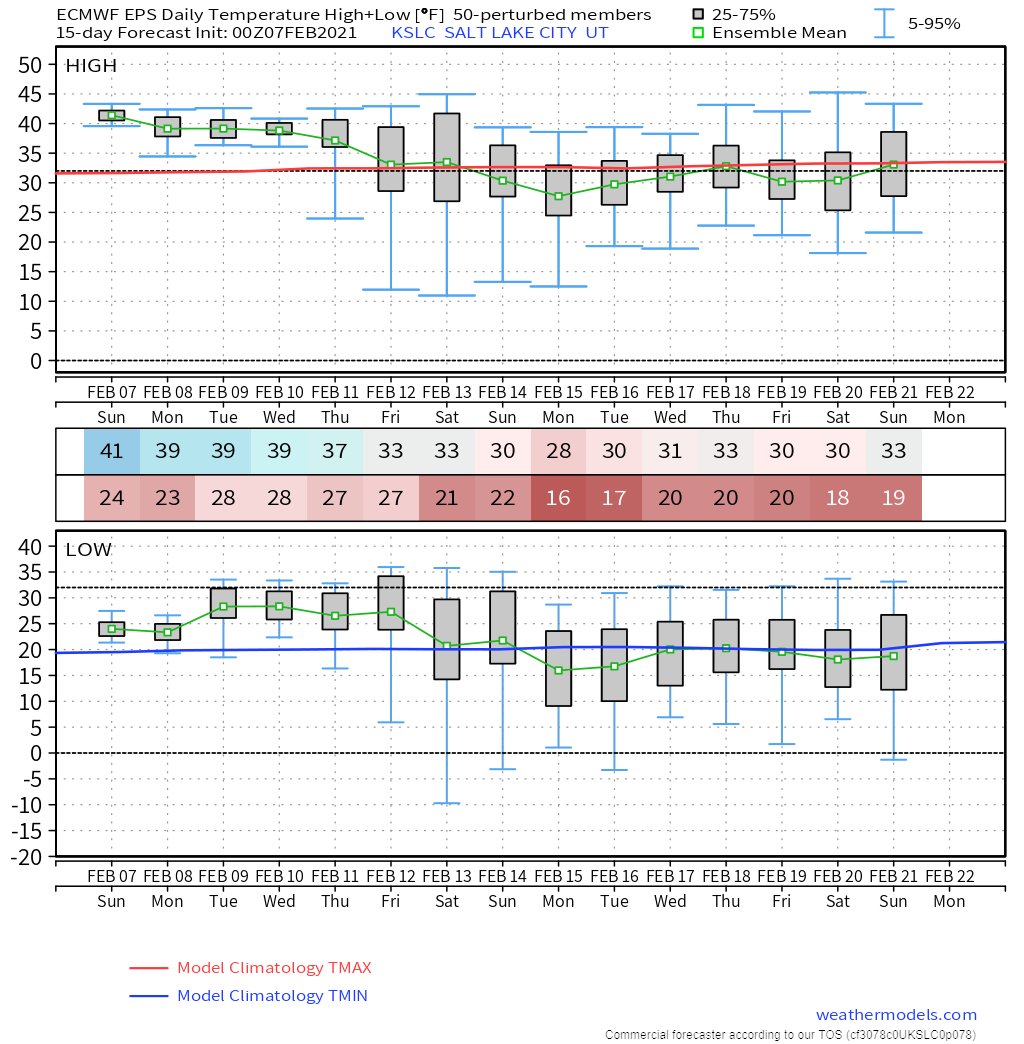
But there's a lot more just below the surface. This map comes from the ECMWF ensemble forecast. It shows the spread among the ensemble members with regard to the temperature forecast at Salt Lake City. Look at the spread in Saturday compared to earlier in the week.
(An ensemble forecast means the particular model is run several times with slightly different initial conditions to create different possible scenarios. This is the "butterfly effect" in action).
Basically, the different forecasts in this ensemble say the high temperature at Salt Lake City could be anywhere between 11°F and 45°F on Saturday! Why the spread? What is giving the model trouble? A pesky Arctic trough.
As a note, the plot I shared comes from the ECMWF model but the other global model systems (Canadian and GFS) we use are showing similar spread. The next plots will include those.
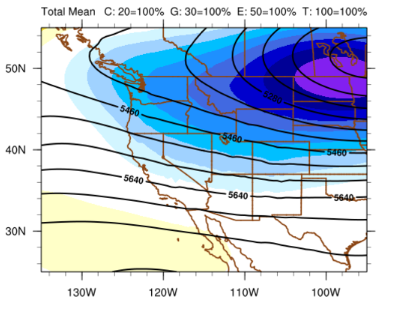
Here is the ensemble mean 500mb height forecast for Saturday. This gives us an idea of what is going on at the upper levels. If you average all of those different ensemble forecasts, you get this, which makes sense with the high temperature forecast I showed for 2/13.
The big purple and blue blob is the expected location (in that ensemble mean) of the coldest air from this Arctic trough. However, this is the case where the mean doesn't tell you the whole story.
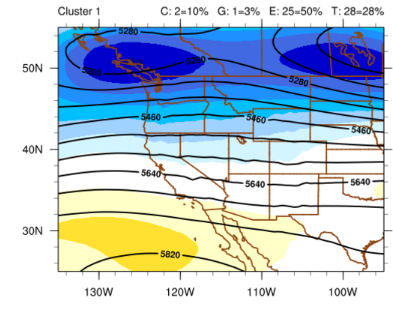
In reality, there are two extremes here. This plot comes from a tool developed to aggregate the different ensemble forecasts into clusters of similar input. This is a solution favored by the Canadian model and would bring REALLY cold air into the area (e.g. that 11° forecast).
Meanwhile, you have an approximately equal number of ensemble members (including half of the ECMWF members) showing this solution, which keeps all of that cold air WELL north of us and gives us high temperatures on 2/13 not too far off what we're expecting today.
So when a situation like this comes about you might wonder what a forecaster is supposed to do. How can you give an accurate temperature forecast when there's so many different opinions? Well, to be honest, there's no good answer. Perhaps we'll go to this old, reliable tool.
In summary: take our forecast for this coming weekend with a HUGE grain of salt right now and we'll hope things become clearer in the coming days. Thanks for reading!

 Read on Twitter


