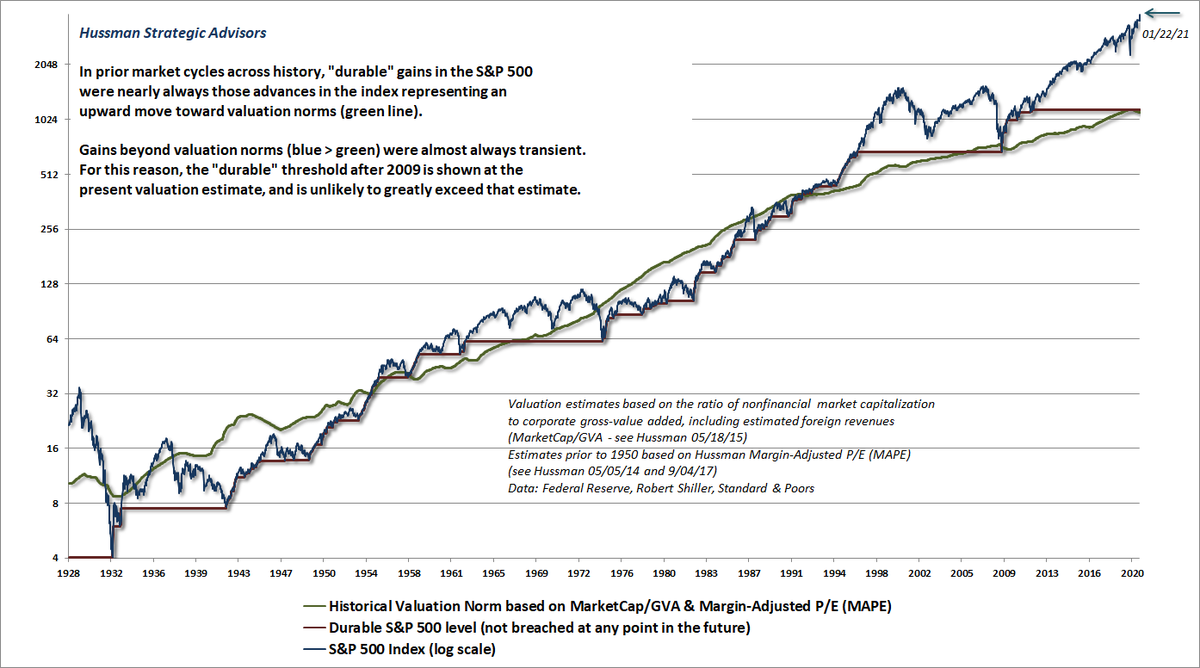
This insanity is impressive.
To be clear, even amid obscene valuations and negative prospective returns, I'd defer a bearish outlook if our gauge of market internals was constructive. That adaptation has served us well. Internals broke a couple of weeks ago and remain that way.
To be clear, even amid obscene valuations and negative prospective returns, I'd defer a bearish outlook if our gauge of market internals was constructive. That adaptation has served us well. Internals broke a couple of weeks ago and remain that way.
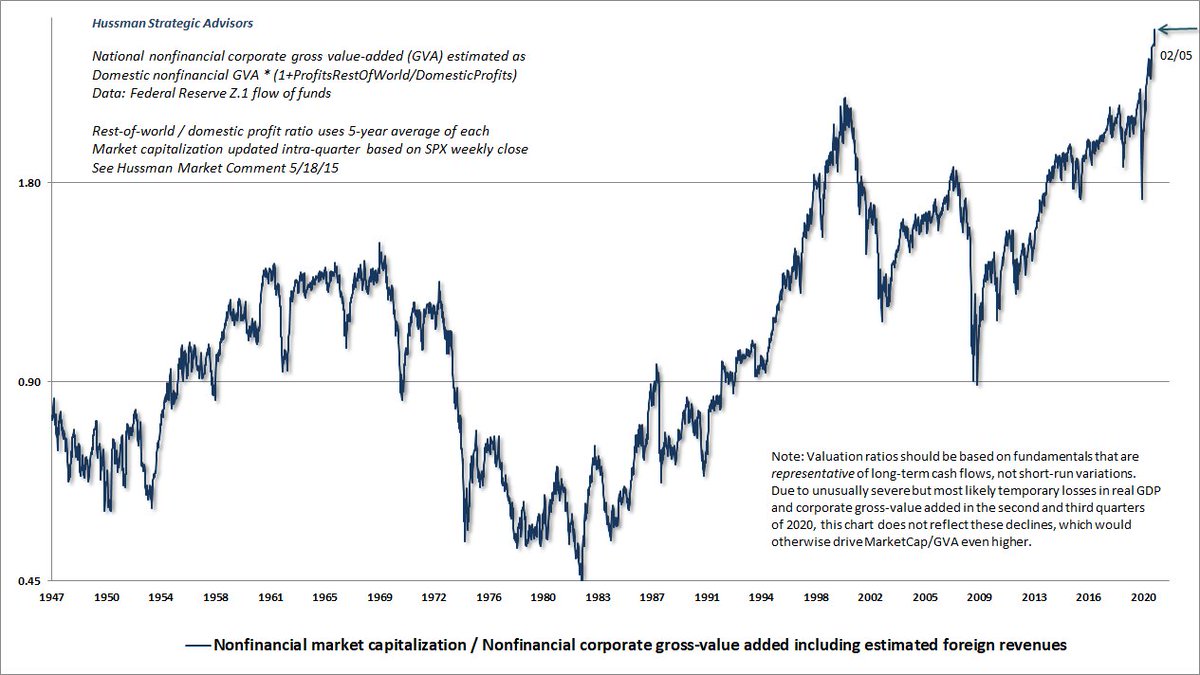
The ratio of nonfinancial market cap to corporate gross value-added (including estimated foreign revenues), is a more reliable indication of subsequent S&P 500 total returns than the forward P/E, Fed Model, Shiller CAPE, or any alternative I've ever tested or introduced. Yikes.
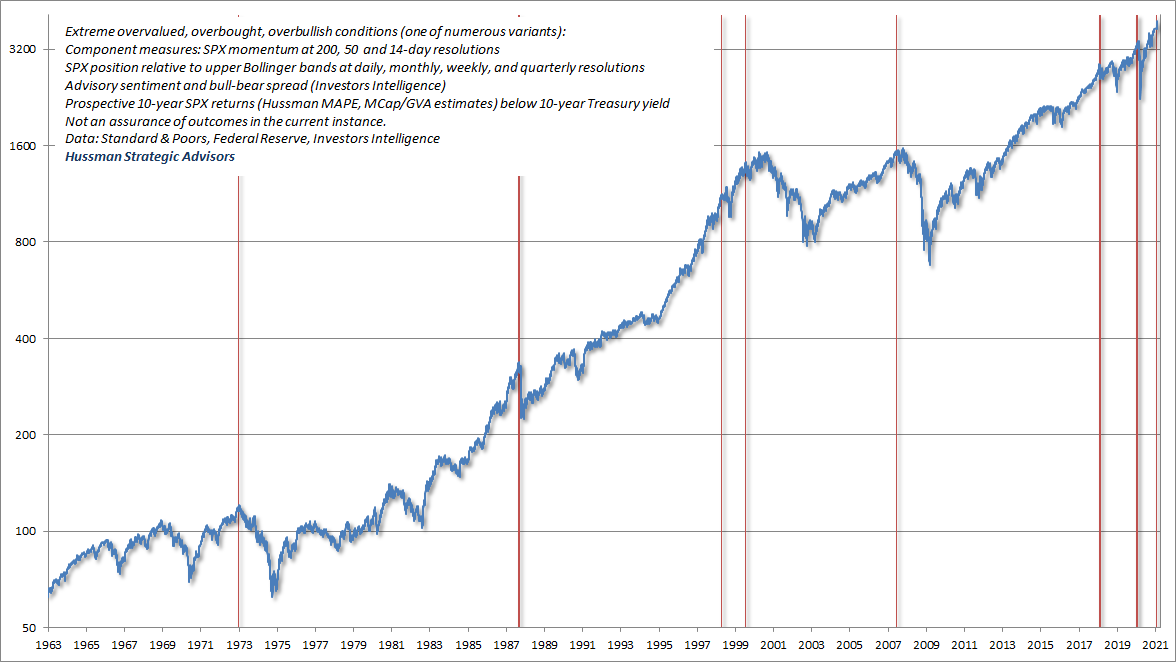
Well, when you're livin' in a van down by the river, at least you can say you had the balls to stay bullish at the most extreme valuations in history, with negative 10-12 year return estimates, lopsided bullishness, and the spu pushing through its upper bands at every resolution.
May help to understand how valuations relate to returns. We're ~3x levels historically associated w/ typical long-term returns of about 10% annually. We don't need to revert to those norms in a zero rate world. It's just that you get a low return, high volatility market otherwise
Though if you want my opinion, I do think we'll revisit those run-of-the-mill historical norms. Even if you expect inflation, remember that valuations are the first casualty. The benefit of inflation on nominal cash flows becomes dominant only after valuations have been crushed.
I noted a couple of tweets back that extreme valuations produce a low-return, high-volatility future. The volatility is mainly because extreme valuations create a situation where small increases in return prospects require very steep price declines. Some of them can be profound.
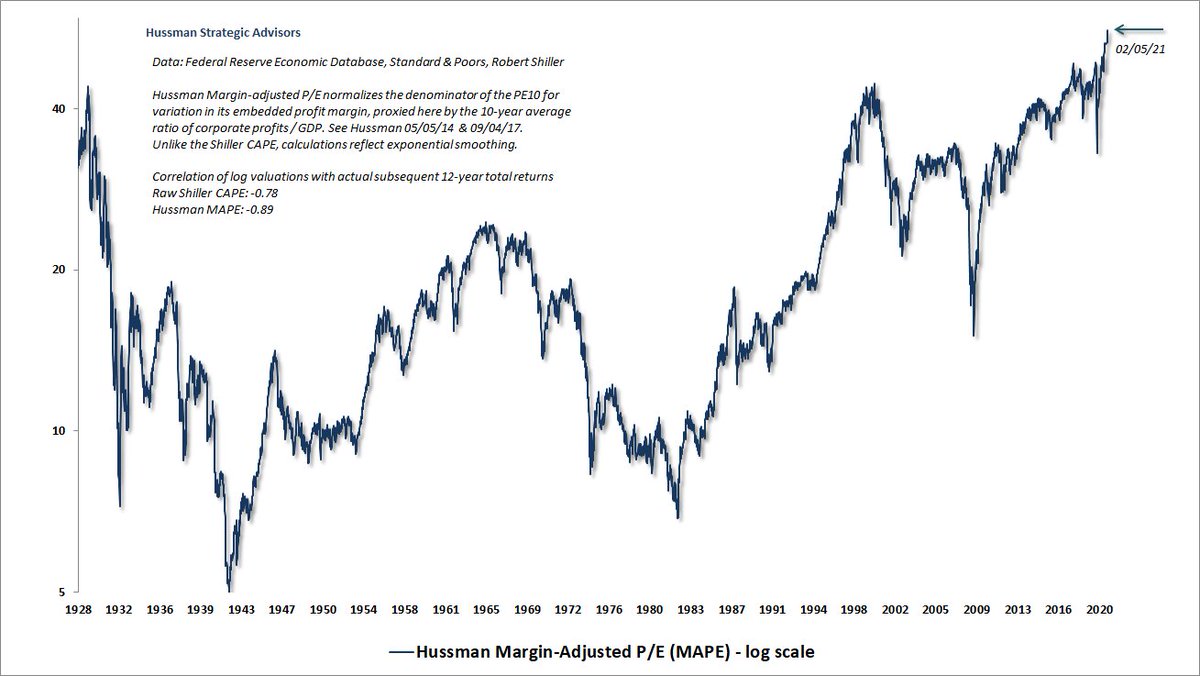
Probably goes without saying that the measure in the preceding chart is beyond 1929 and 2000 extremes.
The MAPE is better correlated w/actual subsequent S&P 500 total returns than any alternative I've studied or introduced, other than MarketCap/GVA. Do with that what you will.
The MAPE is better correlated w/actual subsequent S&P 500 total returns than any alternative I've studied or introduced, other than MarketCap/GVA. Do with that what you will.
Given the singular response to this thread "but.. the Fed"
1) Attention to internals should be sufficient to navigate that, which is why I'm doing just fine amid these extremes.
2) Even if we restrict MCap/GVA to NEVER violate last year's low, it would still imply 45% downside.
1) Attention to internals should be sufficient to navigate that, which is why I'm doing just fine amid these extremes.
2) Even if we restrict MCap/GVA to NEVER violate last year's low, it would still imply 45% downside.
I am assured by a lovely retired librarian that zero interest rates will keep the market elevated because "stocks at least generate dividends."
That's what makes me sad. Read the section titled:
"The Fed has learned nothing, and the public will be hurt." https://www.hussmanfunds.com/comment/mc210201/
That's what makes me sad. Read the section titled:
"The Fed has learned nothing, and the public will be hurt." https://www.hussmanfunds.com/comment/mc210201/
Among various "overvalued, overbought, overbullish" syndromes I track, this one captures when overvaluation & lopsided bullishness is joined by overextension at multiple horizons (see thread). I'd defer my bearish view if internals were uniform.
Not debating. Just sharing FYI.
Not debating. Just sharing FYI.
At 2.93 vs a historical norm of just 0.9, the S&P 500 price/revenue ratio is sitting at the highest level in history.
Over the past 10 years, and the past 25, S&P 500 revenues have grown at an average rate of 3.6%, including the full benefit of buybacks.
I know you don't care.
Over the past 10 years, and the past 25, S&P 500 revenues have grown at an average rate of 3.6%, including the full benefit of buybacks.
I know you don't care.

 Read on Twitter


