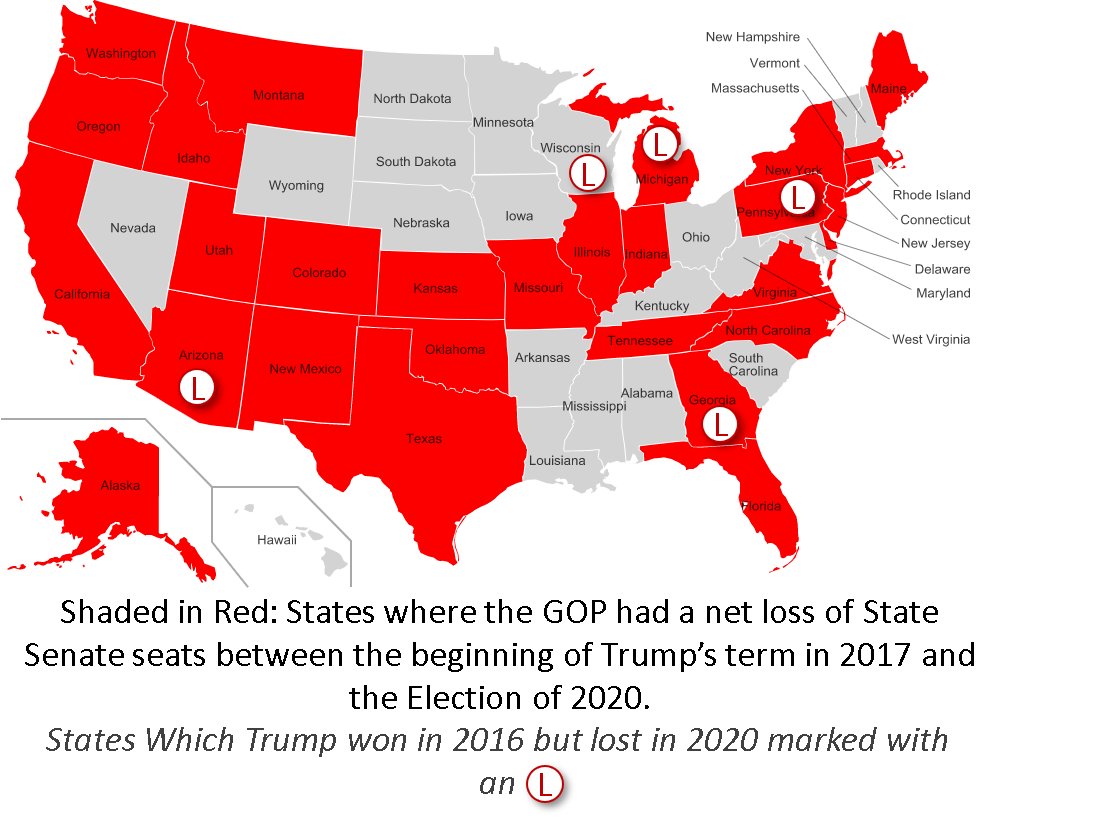
The election of 2020 as explained by a set of maps.
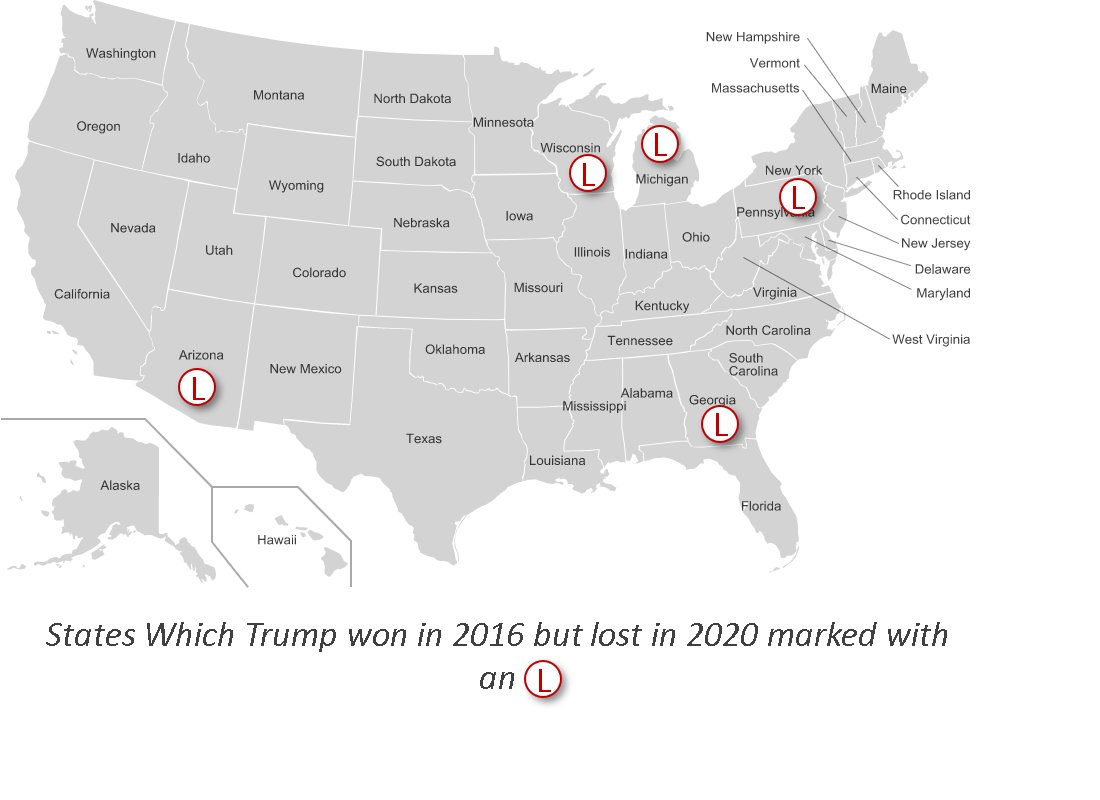
Map 1: Where Trump lost in 2020 after having won in 2016 (whole states only, not including Nebraska's Second Congressional District).
Map 1: Where Trump lost in 2020 after having won in 2016 (whole states only, not including Nebraska's Second Congressional District).
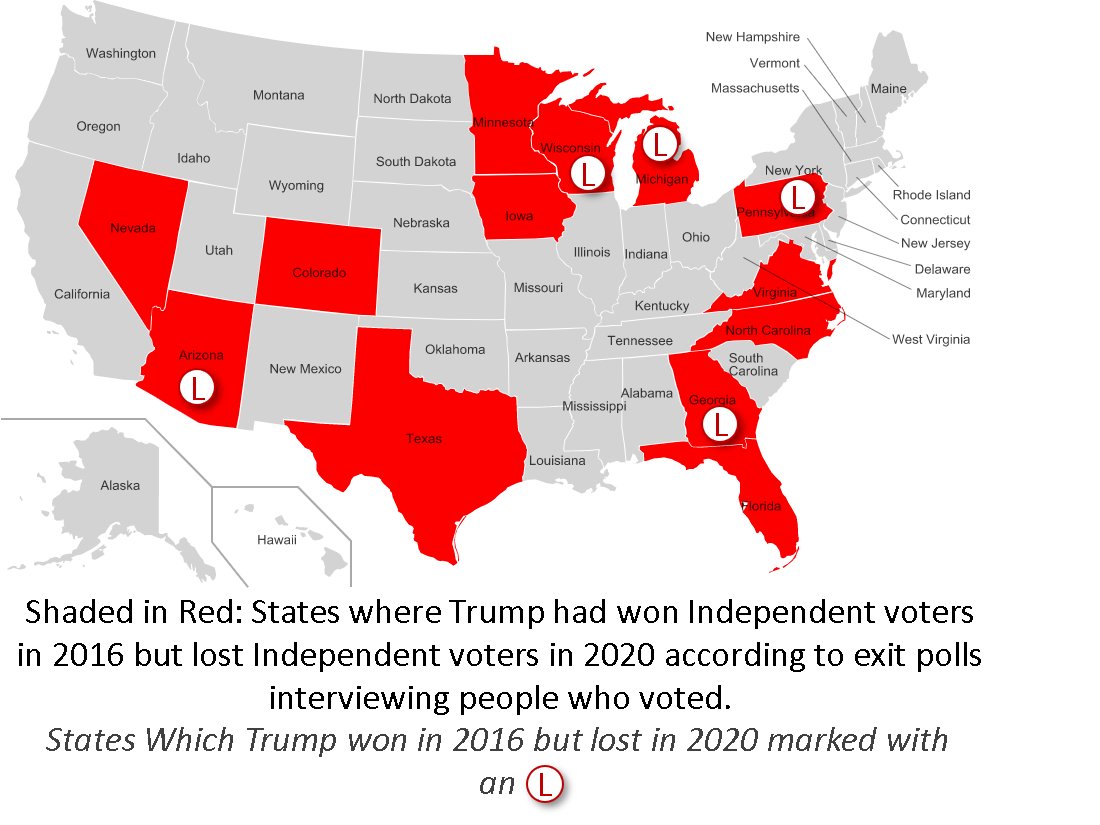
Map 4: Where Trump won Independent voters in 2016 but lost them after in 2020 (after focusing largely on "the base" for four years but turning off many Independents).
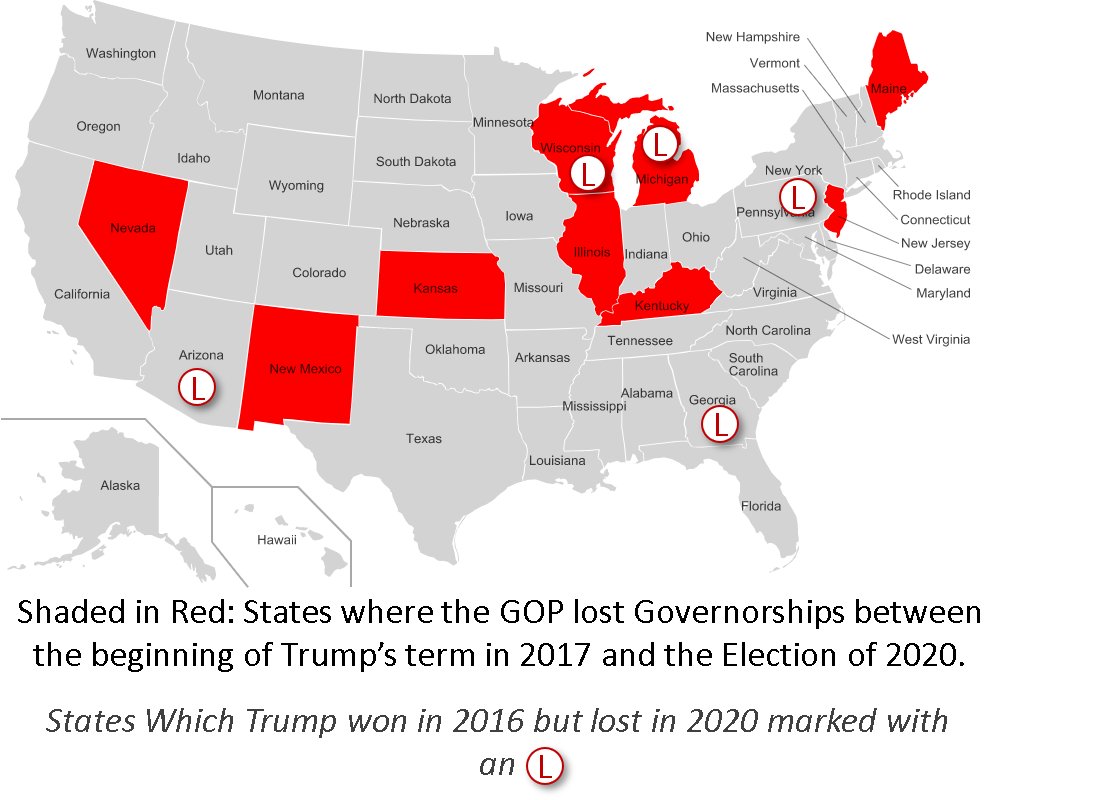
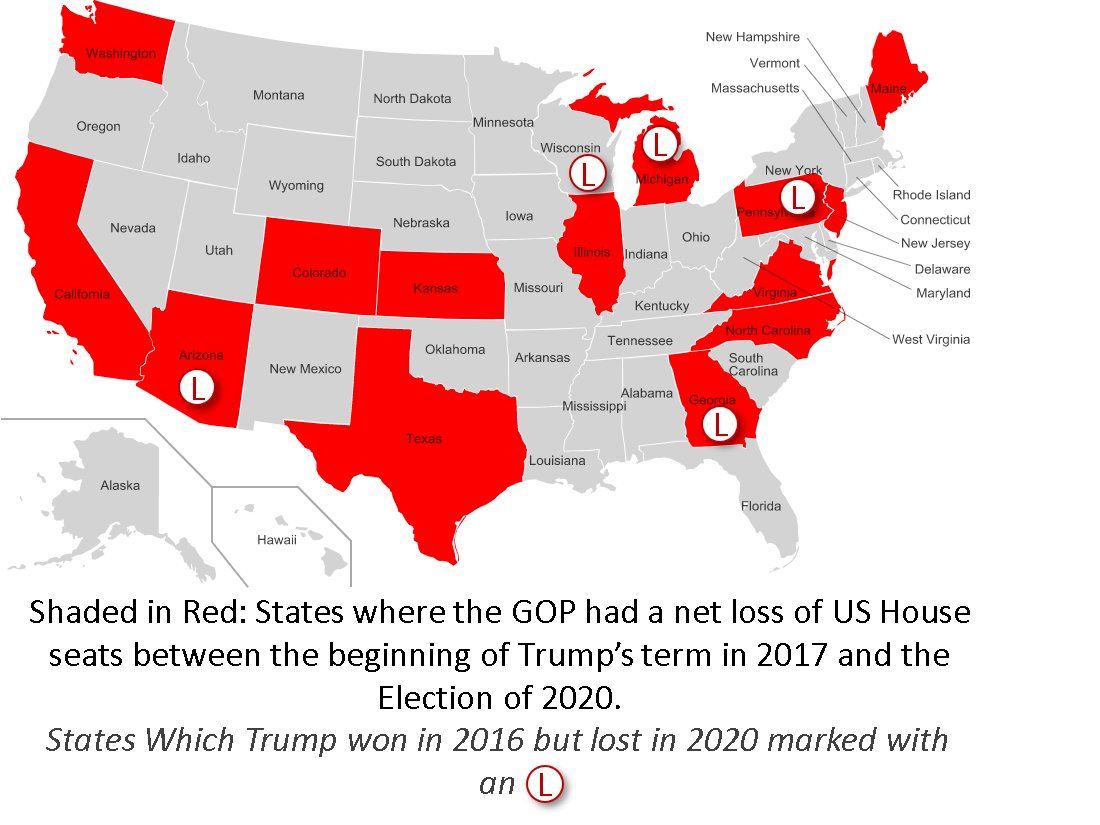
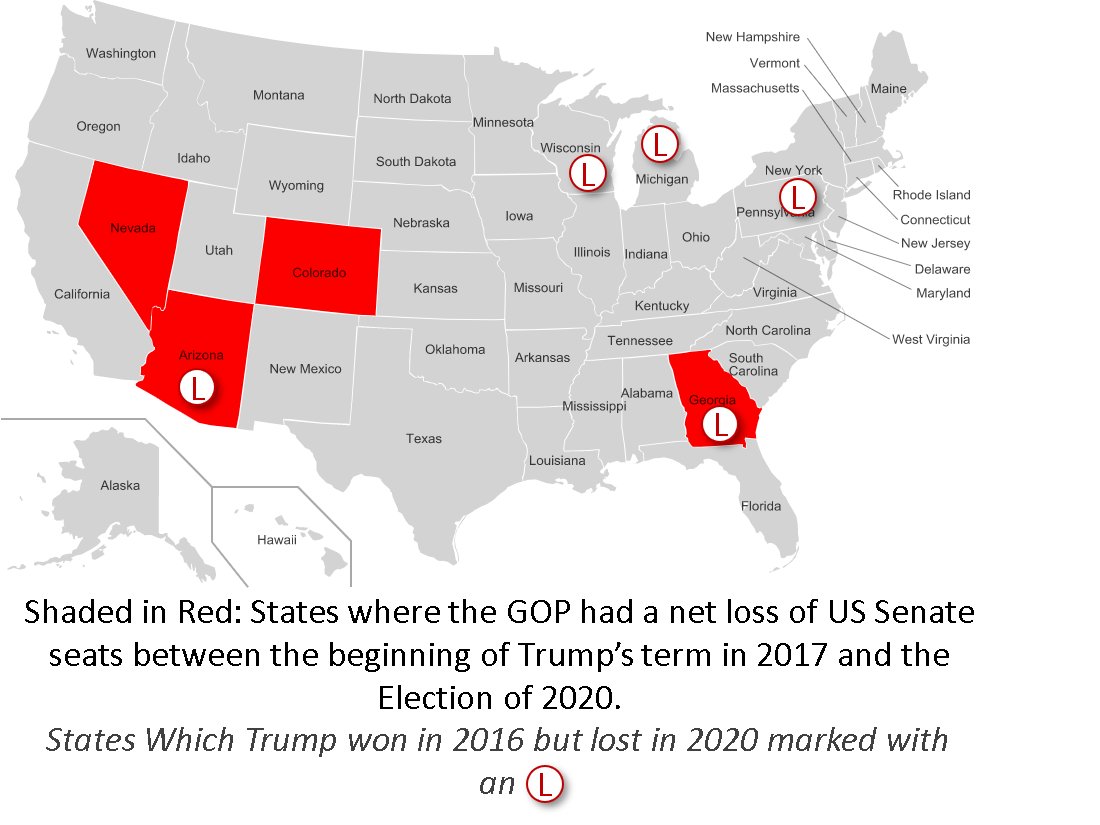
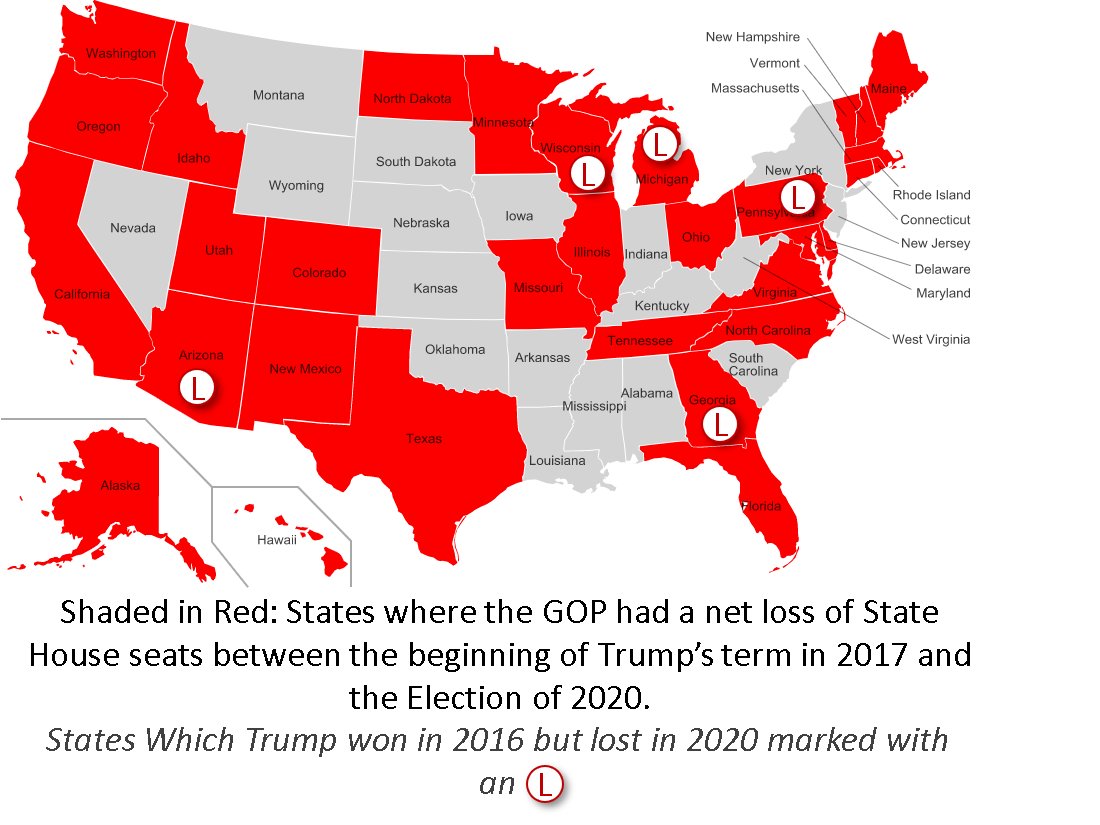
The maps tell a simple story:
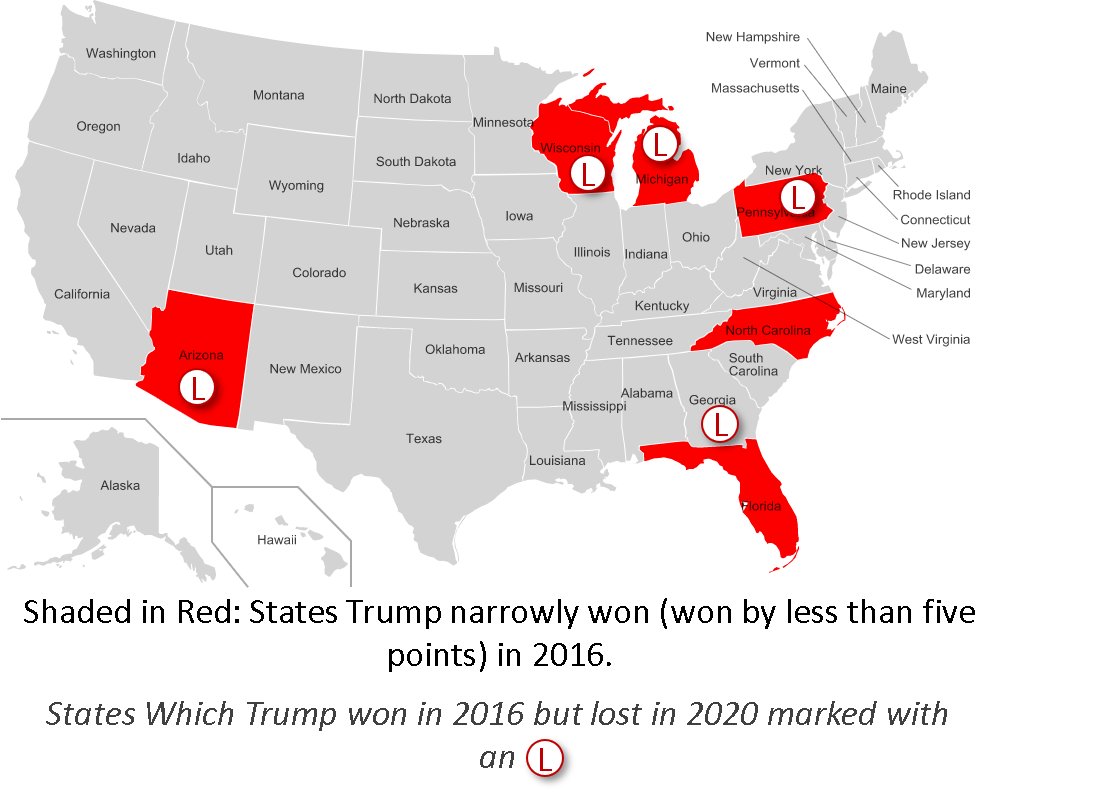
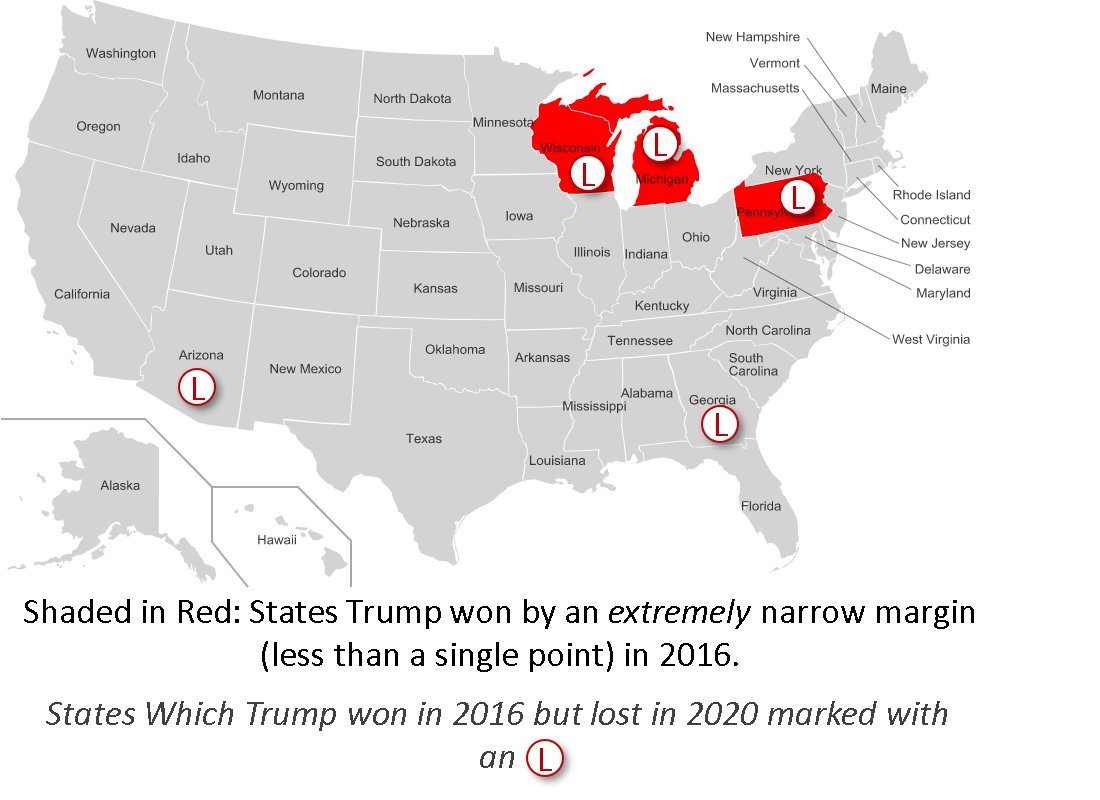
1) Trump barely won in 2016.
2) He lost critical support from Independents.
3) His party suffered in the states he eventually would eventually in 2020.
4) And then he lost those states himself and thus the election.
5) The end.
1) Trump barely won in 2016.
2) He lost critical support from Independents.
3) His party suffered in the states he eventually would eventually in 2020.
4) And then he lost those states himself and thus the election.
5) The end.
(Pardon the grammatical mishaps. I edit and re-edit tweets, all without the benefit of an actual edit button. I inevitably leave an extra word in there accidentally. But you get the point. Good night!)

 Read on Twitter