Are #lockdowns worsening #COVID19 inequities in Toronto?
After months of reading weakly supported claims on the topic, I decided to look into it myself. Here is a #tweetorial on why lockdowns do NOT appear to have changed Toronto’s inequitable distribution of COVID-19 cases.
After months of reading weakly supported claims on the topic, I decided to look into it myself. Here is a #tweetorial on why lockdowns do NOT appear to have changed Toronto’s inequitable distribution of COVID-19 cases.
1/
As a social epidemiologist, I study health inequalities and their determinants around the world. So when @TOPublicHealth data confirmed that COVID-19 was disproportionately affecting racialized and low-income Torontonians in July, I was outraged, but unsurprised.
As a social epidemiologist, I study health inequalities and their determinants around the world. So when @TOPublicHealth data confirmed that COVID-19 was disproportionately affecting racialized and low-income Torontonians in July, I was outraged, but unsurprised.
2/
As these inequities became widely understood, I noted the rise of a new claim.
It stated that lockdowns – the restrictions on schools, businesses, and social gatherings that we rely on to control the pandemic – were responsible for causing or worsening these inequities(!).
As these inequities became widely understood, I noted the rise of a new claim.
It stated that lockdowns – the restrictions on schools, businesses, and social gatherings that we rely on to control the pandemic – were responsible for causing or worsening these inequities(!).
3/
The claim is plausible.
Proponents argue that as the well-off have been able to work from the safety of their homes, others deemed essential workers have had to work in person, balance multiple jobs, and come home to multi-generational or crowded housing (if they are housed).
The claim is plausible.
Proponents argue that as the well-off have been able to work from the safety of their homes, others deemed essential workers have had to work in person, balance multiple jobs, and come home to multi-generational or crowded housing (if they are housed).
4/
The claim has been popularized by some questionable sources (I’ll get back to this), but also by legitimate sources citing real data.
In particular, I was convinced that the claim was likely to be true by this @TorontoStar article in August: https://www.thestar.com/news/gta/2020/08/02/lockdown-worked-for-the-rich-but-not-for-the-poor-the-untold-story-of-how-covid-19-spread-across-toronto-in-7-graphics.html
5/
So how does the article make the case that lockdowns worsened inequality?
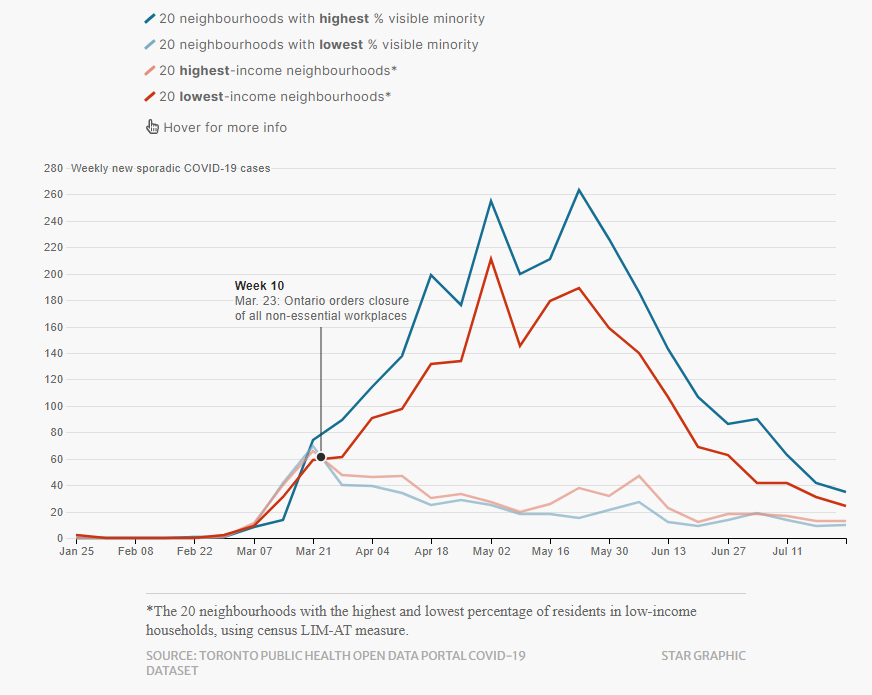
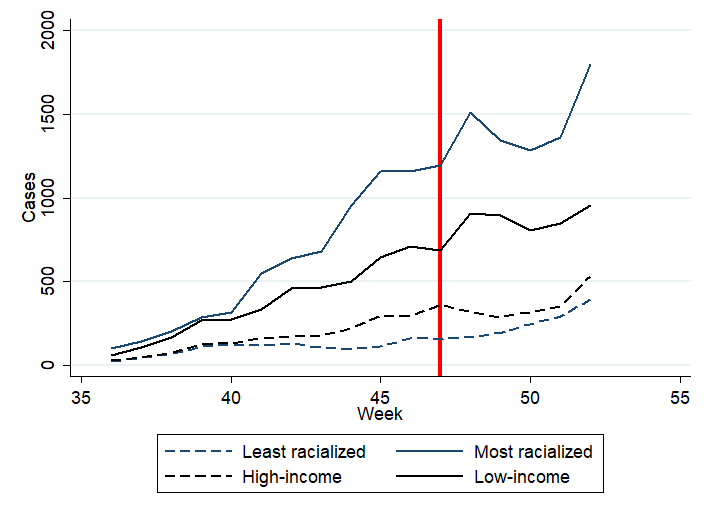
As shown below, they compared the 20 richest and least racialized neighbourhoods with the 20 poorest and most racialized neighbourhoods in Toronto before and after the March lockdown.
So how does the article make the case that lockdowns worsened inequality?
As shown below, they compared the 20 richest and least racialized neighbourhoods with the 20 poorest and most racialized neighbourhoods in Toronto before and after the March lockdown.
6/
The results are striking – after lockdown, cases in the richest and Whitest neighborhoods flatline while the poorest and most racialized bear the brunt of the epidemic.
Now a full year into the pandemic, I decided to see if this pattern could be observed in the second wave.
The results are striking – after lockdown, cases in the richest and Whitest neighborhoods flatline while the poorest and most racialized bear the brunt of the epidemic.
Now a full year into the pandemic, I decided to see if this pattern could be observed in the second wave.
7/
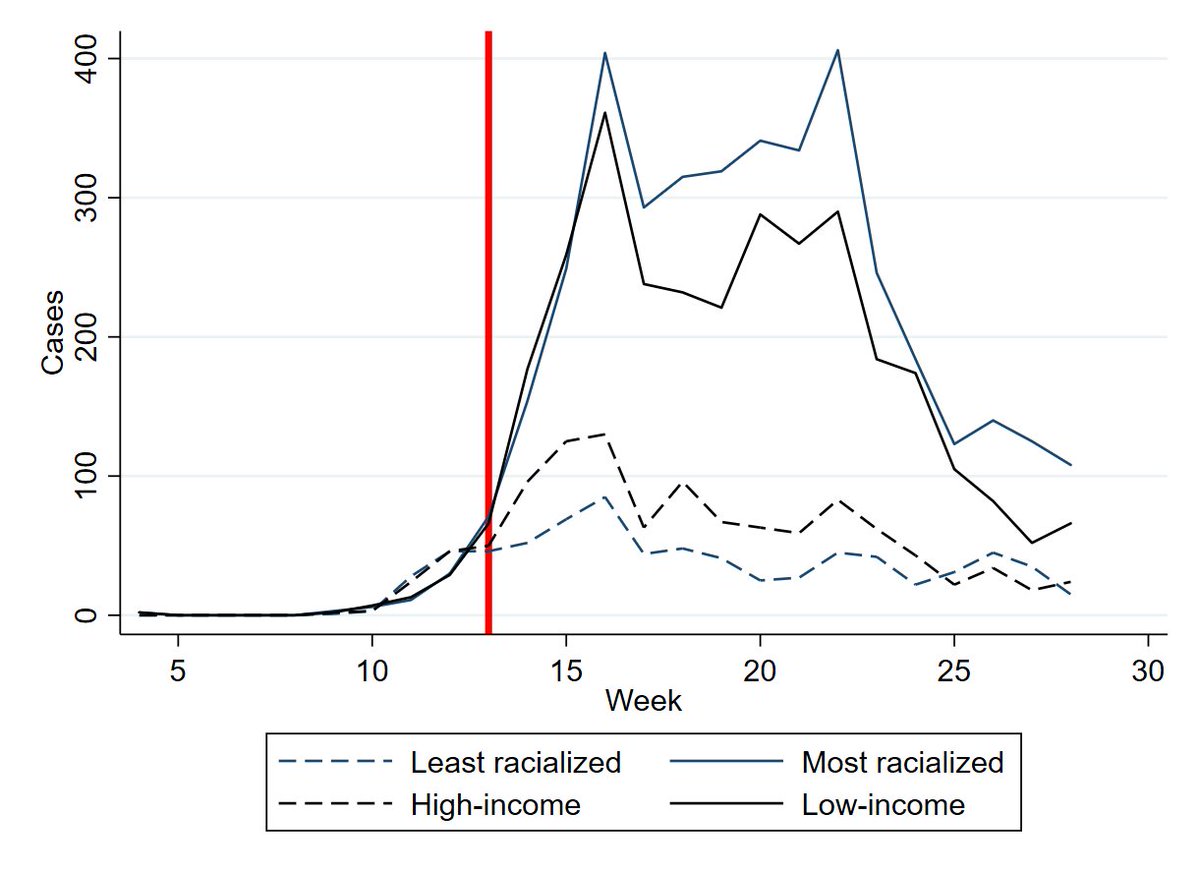
So I pulled data (TY @Open_TO) and replicated the analysis, with a couple important differences. To allow for future int’l comparisons, I use the case report date and all cases instead of episode date and sporadic cases.
Even so, I can recreate the Star figure quite closely.
So I pulled data (TY @Open_TO) and replicated the analysis, with a couple important differences. To allow for future int’l comparisons, I use the case report date and all cases instead of episode date and sporadic cases.
Even so, I can recreate the Star figure quite closely.
8/
Ok so let’s start to run some analyses.
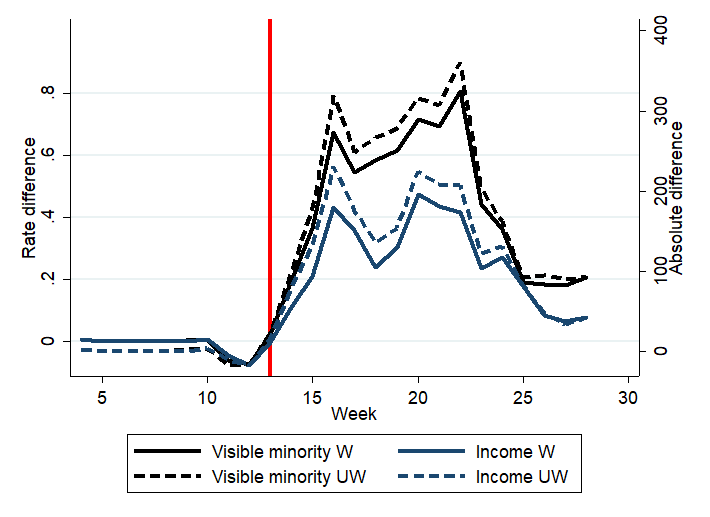
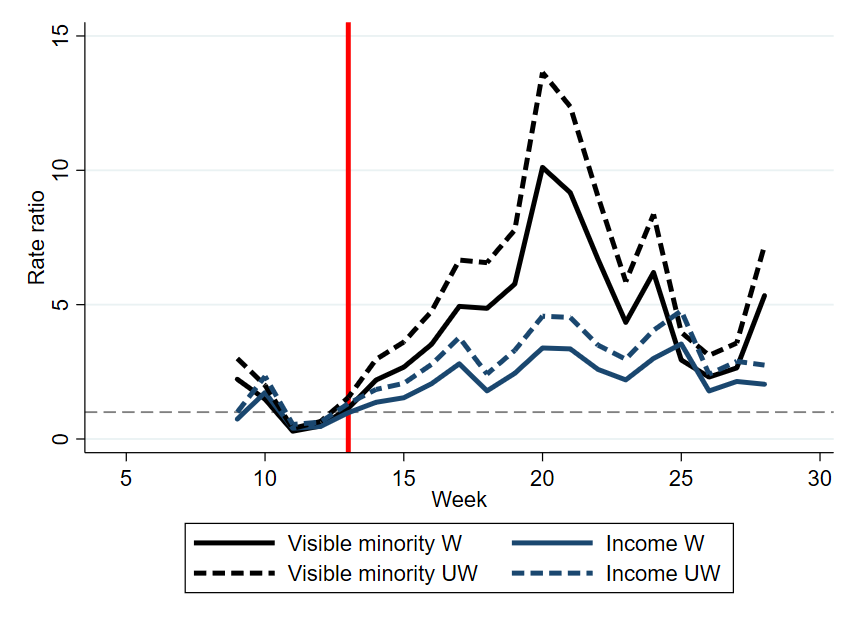
There are 2 main ways to compare these data:
1) Absolute difference using simple subtraction (left), and
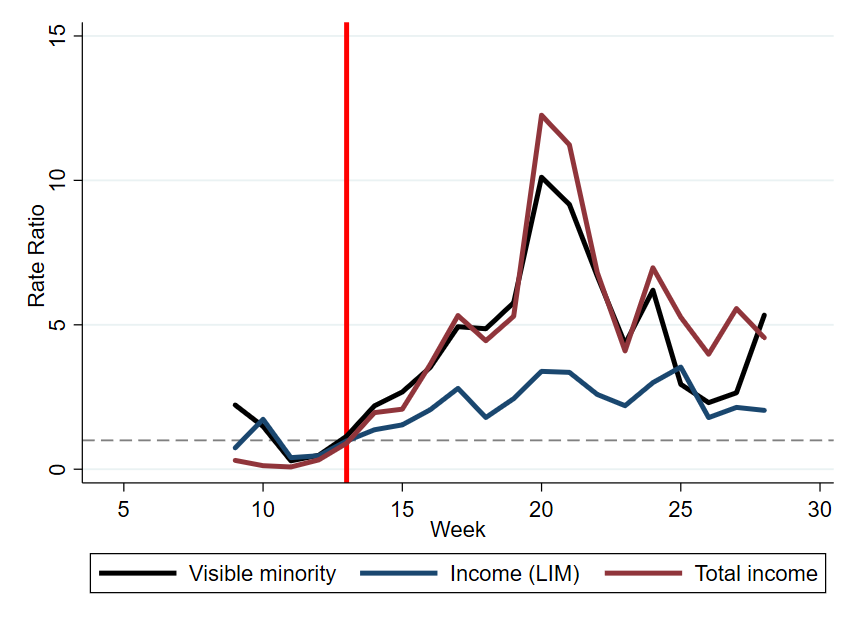
2) Relative difference using division (right). Here anything greater than 1 signifies higher risk (2=2x higher risk, 3=3x, etc.)
Ok so let’s start to run some analyses.
There are 2 main ways to compare these data:
1) Absolute difference using simple subtraction (left), and
2) Relative difference using division (right). Here anything greater than 1 signifies higher risk (2=2x higher risk, 3=3x, etc.)
9/
Then we hit problem number one.
It turns out that the 20 most racialized and poorest neighbourhoods are nearly twice as populous as the 20 comparators. That means that all things being equal, we would expect twice as many cases in these neighborhoods!
Then we hit problem number one.
It turns out that the 20 most racialized and poorest neighbourhoods are nearly twice as populous as the 20 comparators. That means that all things being equal, we would expect twice as many cases in these neighborhoods!
10/
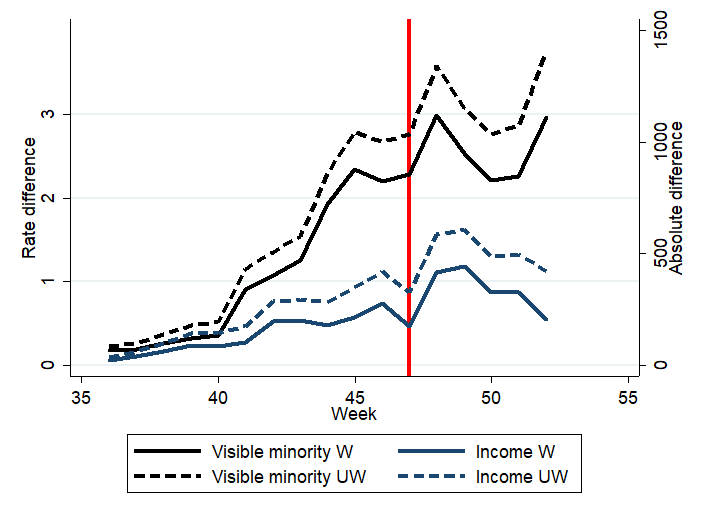
That’s easy enough to take care of – we just need to adjust our cases by neighborhood population.
The new weighted (W) weekly incidence rates per 1k population in solid lines result in smaller, but still highly significant differences.
That’s easy enough to take care of – we just need to adjust our cases by neighborhood population.
The new weighted (W) weekly incidence rates per 1k population in solid lines result in smaller, but still highly significant differences.
11/
By now you may notice that race-based inequities are way larger than income-based ones.
However, the Star used LIM-AT as a measure of income. In my experience, this is a valid but not ideal measure, so I added total household income as an alternate measure.
By now you may notice that race-based inequities are way larger than income-based ones.
However, the Star used LIM-AT as a measure of income. In my experience, this is a valid but not ideal measure, so I added total household income as an alternate measure.
12/
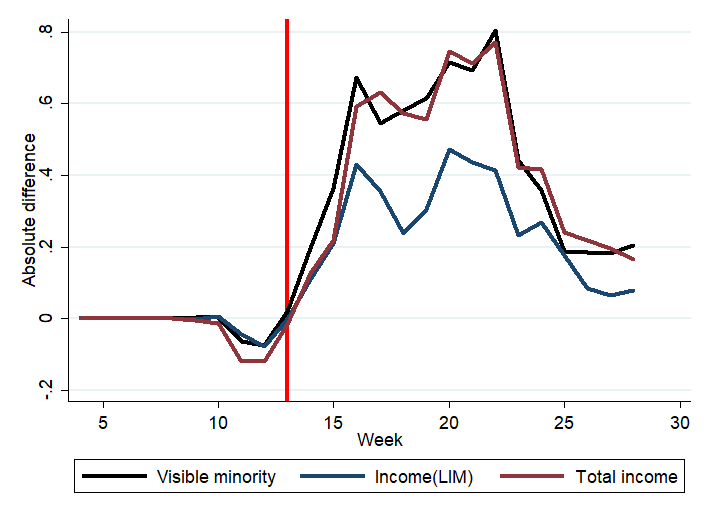
The new income measure (red) results in inequities that are roughly the same as race-based inequities (black), which are in turn both larger than LIM-AT-based inequities (blue).
More importantly, inequity still appears to take off right after lockdown for all three measures.
The new income measure (red) results in inequities that are roughly the same as race-based inequities (black), which are in turn both larger than LIM-AT-based inequities (blue).
More importantly, inequity still appears to take off right after lockdown for all three measures.
13/
Now comparing the top/bottom 20 neighborhoods is informative, but we’re missing data on 100 others!
To evaluate the impact of racism and classism throughout the spectrum of income & racialization, we need to calculate concentration indices (CIs).
Now comparing the top/bottom 20 neighborhoods is informative, but we’re missing data on 100 others!
To evaluate the impact of racism and classism throughout the spectrum of income & racialization, we need to calculate concentration indices (CIs).
14/
The CI analyzes the entire population distribution, ranging from -1 (all cases among marginalized) to 1 (all cases among well-off), with 0 indicating equality.
We now see that although the inequities are still there, the early shift to inequity started weeks before lockdown.
The CI analyzes the entire population distribution, ranging from -1 (all cases among marginalized) to 1 (all cases among well-off), with 0 indicating equality.
We now see that although the inequities are still there, the early shift to inequity started weeks before lockdown.
15/
So maybe this is a little more complicated than we first thought…
Let’s take a look at Toronto’s second epidemic wave with the same methods to see if we can get some more clarity on what’s happening.
So maybe this is a little more complicated than we first thought…
Let’s take a look at Toronto’s second epidemic wave with the same methods to see if we can get some more clarity on what’s happening.
16/
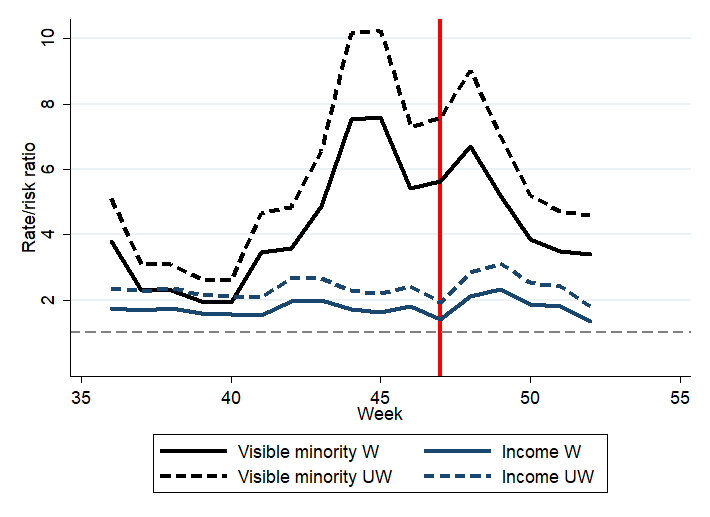
We quickly see the same patterns of inequity taking root, with solid lines diverging from dotted lines as soon as the second wave begins.
But the timing of this divergence means the plausibility of lockdown being a key driver of these inequities is immediately suspect.
We quickly see the same patterns of inequity taking root, with solid lines diverging from dotted lines as soon as the second wave begins.
But the timing of this divergence means the plausibility of lockdown being a key driver of these inequities is immediately suspect.
17/
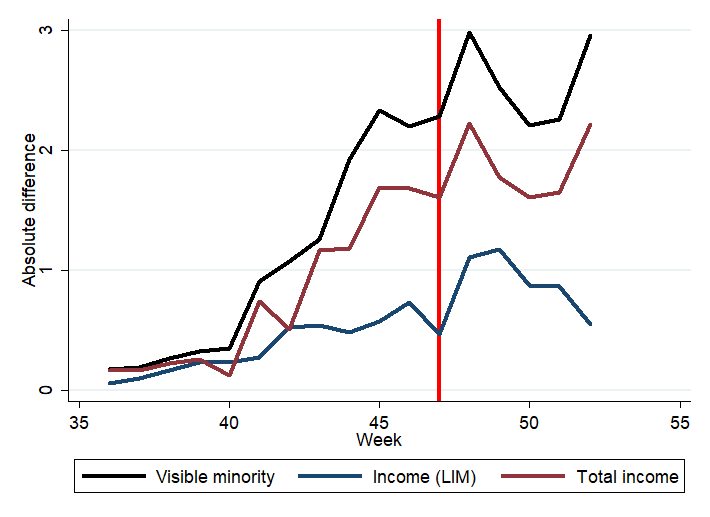
Let’s quickly run through all the same calculations as before, adjusting for population and adding our new income measure for both absolute and relative difference.
The more we see, the weaker the link between lockdowns and inequity is looking…
Let’s quickly run through all the same calculations as before, adjusting for population and adding our new income measure for both absolute and relative difference.
The more we see, the weaker the link between lockdowns and inequity is looking…
18/
The CI confirms it. No matter which measure we look at or how much of a delay we’d expect for an effect to take hold - wave two lockdown was followed by an unmistakable decrease in inequity (remember 0 = equality here).
If anything, lockdown appears to have improved equity.
The CI confirms it. No matter which measure we look at or how much of a delay we’d expect for an effect to take hold - wave two lockdown was followed by an unmistakable decrease in inequity (remember 0 = equality here).
If anything, lockdown appears to have improved equity.
19/
Let’s zoom out and take in the whole picture now. For reference, I’ve also added reopening dates (green) and significant public health restriction dates (thin red) on the right.
There’s just no way to make the case that lockdowns are causing Toronto’s inequities.
Let’s zoom out and take in the whole picture now. For reference, I’ve also added reopening dates (green) and significant public health restriction dates (thin red) on the right.
There’s just no way to make the case that lockdowns are causing Toronto’s inequities.
20/
So does that mean there’s no problem here?
ABSOLUTELY NOT.
Except for a brief period at the very start of the epidemic, poor and racialized neighborhoods in Toronto have been disproportionately affected by the pandemic.
Every. Single. Week.
So does that mean there’s no problem here?

ABSOLUTELY NOT.
Except for a brief period at the very start of the epidemic, poor and racialized neighborhoods in Toronto have been disproportionately affected by the pandemic.
Every. Single. Week.
21/
The problem isn’t that lockdowns are causing inequities – the problem is that structural racism and classism are so deeply ingrained into the fabric of our city that the epidemic immediately became inequitable and has remained so throughout the entire year.
The problem isn’t that lockdowns are causing inequities – the problem is that structural racism and classism are so deeply ingrained into the fabric of our city that the epidemic immediately became inequitable and has remained so throughout the entire year.
22/
Here’s where I have to call out blatant misinformation. @MartinKulldorff and the rest of the “Great Barrington” crowd have been crying crocodile tears over these inequities – which they fully blame on lockdowns – all while calling for an end to these necessary measures.
Here’s where I have to call out blatant misinformation. @MartinKulldorff and the rest of the “Great Barrington” crowd have been crying crocodile tears over these inequities – which they fully blame on lockdowns – all while calling for an end to these necessary measures.
23/
Poor and racialized Torontonians need an end to this pandemic - yesterday.
Lockdowns are one of many public health measures needed to put an end to uncontrolled viral spread, along with universal paid sick leave and expanded social protection.
Poor and racialized Torontonians need an end to this pandemic - yesterday.
Lockdowns are one of many public health measures needed to put an end to uncontrolled viral spread, along with universal paid sick leave and expanded social protection.
24/
To wrap up, I’ll note that I examined inequities in COVID-19 cases and not economic, mental health, and long-term lockdown impacts.
Let me know your thoughts, and most importantly, know that we must do better if we want Toronto to be a just, equitable, and healthy city.
To wrap up, I’ll note that I examined inequities in COVID-19 cases and not economic, mental health, and long-term lockdown impacts.
Let me know your thoughts, and most importantly, know that we must do better if we want Toronto to be a just, equitable, and healthy city.

 Read on Twitter

