Today I'm taking you through a thread analyzing the swinging strike rate (SwStr%) metric. We will do this mainly from the pitcher's perspective.
The formula for calculating SwStr% is simple - it is just total pitches thrown divided by pitches that ended with a swing and miss. So it's the percent of a pitcher's pitches that get a whiff.
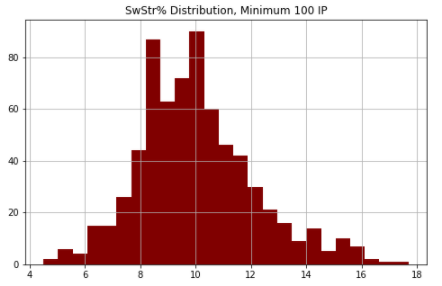
Here is the distribution of all swinging strike rates posted between 2015 and 2020 from pitchers that reached 100 or more innings pitched in a given year. You can see most values are between 8 and 11 with the highest values between 15 and 17.
Here are your top 5 swinging strike seasons of recent history
Pitcher | Year | SwStr%
--------------------------
B. Snell | 2019 | 17.7%
G. Cole | 2019 | 16.8%
Scherzer | 2019 | 16.4%
Salazar | 2017 | 16.4%
Scherzer | 2018 | 16.1%
Pitcher | Year | SwStr%
--------------------------
B. Snell | 2019 | 17.7%
G. Cole | 2019 | 16.8%
Scherzer | 2019 | 16.4%
Salazar | 2017 | 16.4%
Scherzer | 2018 | 16.1%
and the lowest
Pitcher | Year | SwStr%
--------------------------
Phelps | 2015 | 4.5%
Cain | 2017 | 4.9%
Buehrle | 2015 | 5.2%
Fister | 2015 | 5.2%
Colon | 2018 | 5.4%
Pitcher | Year | SwStr%
--------------------------
Phelps | 2015 | 4.5%
Cain | 2017 | 4.9%
Buehrle | 2015 | 5.2%
Fister | 2015 | 5.2%
Colon | 2018 | 5.4%
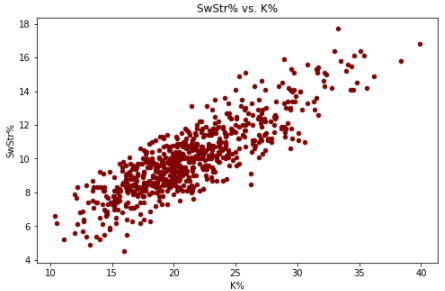
You can sometimes use swinging-strike rate to identify bad luck in the strikeouts category. If a pitcher has a high SwStr% but a low K%, you can feel pretty good about more strikeouts coming in the future.
In lamens terms of what's good and what's bad:
Bad: < 8%
Average: 8% - 11%
Good: 11% - 13%
Great: 13-15%
Elite: > 15%
Bad: < 8%
Average: 8% - 11%
Good: 11% - 13%
Great: 13-15%
Elite: > 15%
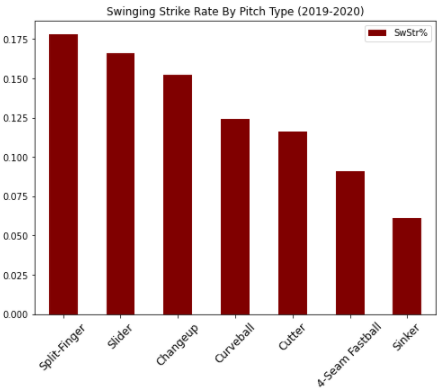
In terms of individual pitches, the swinging strike rates vary quite a bit. Splitters, sliders, and changeups generate the highest SwStr% while four-seamers and sinkers generate the lowest.
Here are the numbers shown by that visualization
Splitter - 17.8%
Slider - 16.6%
Changeup - 15.2%
Curveball - 12.4%
Cutter - 11.6%
4-Seam - 9.1%
Sinker/2-Seam - 6.1%
Splitter - 17.8%
Slider - 16.6%
Changeup - 15.2%
Curveball - 12.4%
Cutter - 11.6%
4-Seam - 9.1%
Sinker/2-Seam - 6.1%
So sinkerball pitchers (think Dustin May) will almost always have lower swinging strike rates, and pitchers that throw a lot of breaking balls and off-speed stuff (think Kenta Maeda) will have higher
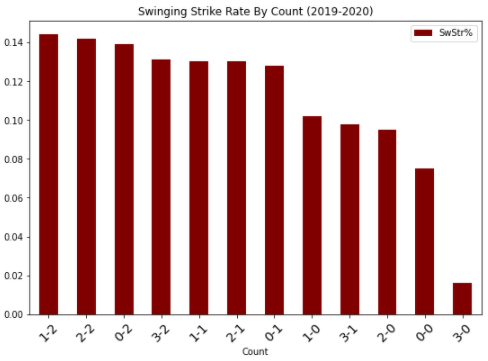
I also found the SwStr% for each possible count. No surprise that the leading counts were all two-strike counts when hitters are more likely to be swinging.
should've said this at the beginning, but this stat can often be confused with "Whiff Rate", which is a different calculation. Whiff% is the percentage of swings and misses *only on pitches that were swung on*. If a hitter doesn't swing, it doesn't factor in.
Whiff rates will be much higher than swinging strike rates. Rule of thumb: if the value is under 20%, it's using total pitches as the denominator. If it's above 20%, it's using swings.
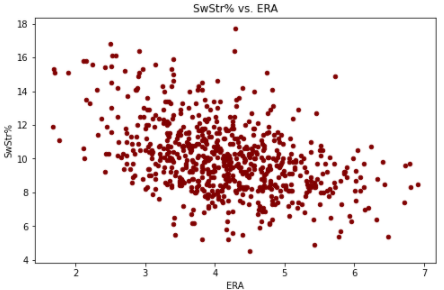
bottom line is that swinging strike rate is a great indicator of skill and future performance. The swinging strike leaderboard is typically a list of the best pitchers in the game
But it is important to keep the pitch mix in mind when looking at a pitcher's SwStr%. As we noted above, throwing a lot of sinkers will hurt a pitcher in this category, and that doesn't necessarily mean they're a less effective pitcher (but they are almost surely getting less Ks)
that's it and that's all, retweets are appreciated! Back later with another stat!
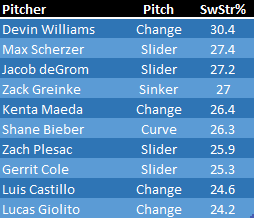
I realize this screenshot contradicts what I said about values that are above 20% usually being whiff rates (using total swings and not total pitches).. the best pitches in the game will have SwStr%'s well above 20.

 Read on Twitter