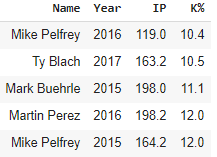
Going to put together some threads @MattWi77iams style over the next couple weeks, but instead of breaking down players I'll be breaking down statistical categories. There's so many we rely on in fantasy baseball, and it helps to really understand them and their distributions.
I'll start with a real simple one that most fantasy players already understand very well - strikeout rate (K%).
The formula is simply K/PA, or total batters faced divided by strikeouts. It is just showing you what percentage of total hitters faced that a pitcher strikes out.
The formula is simply K/PA, or total batters faced divided by strikeouts. It is just showing you what percentage of total hitters faced that a pitcher strikes out.
This stat is more indicative of ability than K/9 because of the denominator. The denominator on K/9 is innings pitched, and you can't get an inning pitched until you get three outs.
Example inning:
2B, BB, K, HR, K, 1B, HR, BB, HR, K
Disaster inning, but K/9 is a perfect 27 because all three outs were made by the strikeout. You'd be very impressed with the K/9 there. However, the K% is much less impressive at 30% (3 strikeouts / 10 batters faced).
2B, BB, K, HR, K, 1B, HR, BB, HR, K
Disaster inning, but K/9 is a perfect 27 because all three outs were made by the strikeout. You'd be very impressed with the K/9 there. However, the K% is much less impressive at 30% (3 strikeouts / 10 batters faced).
K% is a much better indicator of pitcher ability. But what is a good K%? Here's the distribution of all strikeout rates posted in the last six years for pitchers with 100+ IP, shown by a histogram.
A histogram shows you each value along with how many of those values occurred. So you see the tallest bar exceeds 80, which means there were more than 80 occurrences of a pitcher posting a 20-22% K%, meaning the average will be right around there.
You can also see here that the highest rates are around 39% and the lowest are near 12%, but those values are very rare to see.
Here's the distribution broken down by quartiles:
Minimum: 10.4%
25th Percentile: 18.1%
50th Percentile (median): 20.6%
75th Percentile: 24.0%
Max: 39.9%
This means if you're above 24%, you're in the top fourth. The average value is 21.3%.
Minimum: 10.4%
25th Percentile: 18.1%
50th Percentile (median): 20.6%
75th Percentile: 24.0%
Max: 39.9%
This means if you're above 24%, you're in the top fourth. The average value is 21.3%.
Put another, more subjective way:
Bad: <18%
Average: 18%-24%
Good: 24%-27%
Great: 27%-30%
Elite: 30%+
Bad: <18%
Average: 18%-24%
Good: 24%-27%
Great: 27%-30%
Elite: 30%+
K% has been majorly on the rise in the last handful of years, making it not apples to apples to compare a 2020 K% to a 2015 figure.
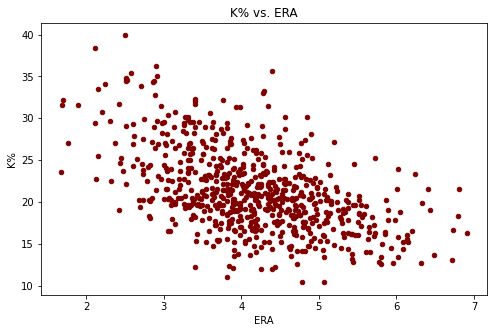
Another thing that makes K% incredibly important is its predictive power. If you strike out 30% of the batters you face, that leaves just 70% of total PA's left to hurt you. Here's the relationship between K% and ERA, for example
You can see there that as K% rises, ERA falls. If you look at just pitchers with 30% strikeout rates or above, their average ERA is 3.09. For the whole league, that average is 4.14. It is very hard to post a bad ERA while you're getting this many strikeouts.
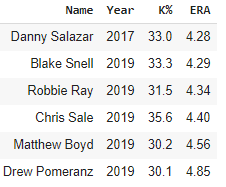
In fact, only six pitchers have had ERA's above 4.00 with a 30%+ strikeout rate since 2015. Here they are.
So that's it for K%, I'll be back with another stat tomorrow. Requests are welcomed!

 Read on Twitter


