I'm surrounded by genius data scientists, CV, football people and tooling... but doing my own EFL fanalyst stuff will always be fun/educational
So, I spent a few hours using k-means to cluster every pass in League 2 this year and visualised those a team uses more than most

So, I spent a few hours using k-means to cluster every pass in League 2 this year and visualised those a team uses more than most
There's loads of failings in my approach, but it did throw up a little insight and some interesting narratives. Some teams are clearly more happy happy to play out from the back, but Crewe take this to a whole new level
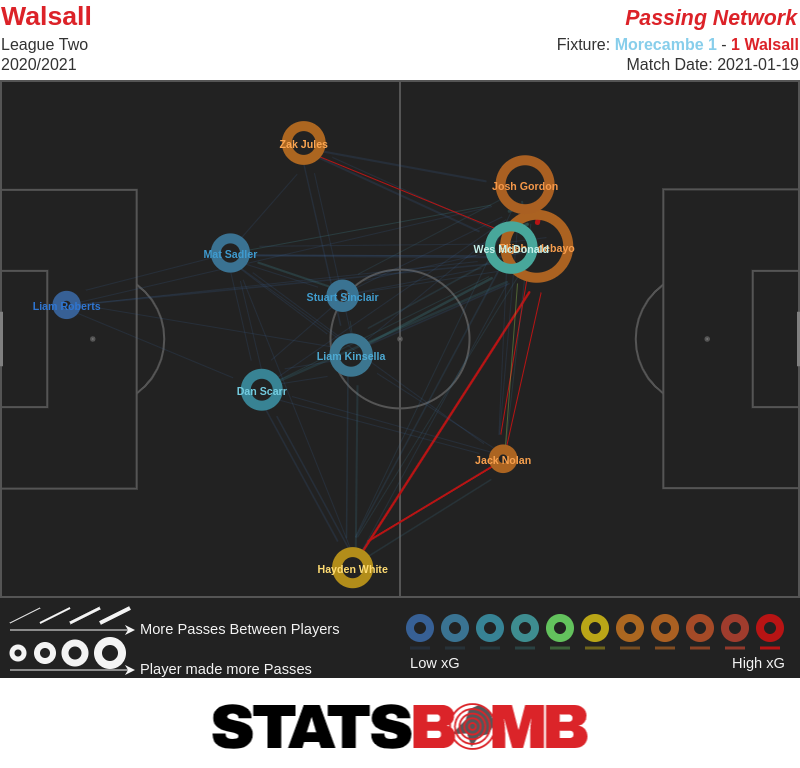
I then used less clusters and looked at box entries. I remember Darrell Clarke once saying his teams will give a striker the opportunity to get 20+ goals. He since found ways to get players in support of a main striker chances which continues at Walsall where xG is well shared
All their successful box entry passes are shown below, but only pass types they've used more than most have fuller opacity. It highlighted they reach dangerous areas regularly. They have xG befitting of their mid-table position but seem to regularly occupy dangerous areas
Digging deeper, these are all UNpressured passes. Most however are off the ground and only 61 out of 155 are successful. Could a little better movement, quality/composure or better pass selection for that "final" ball see them scoring more despite losing Adebayo to Luton?

 Read on Twitter


