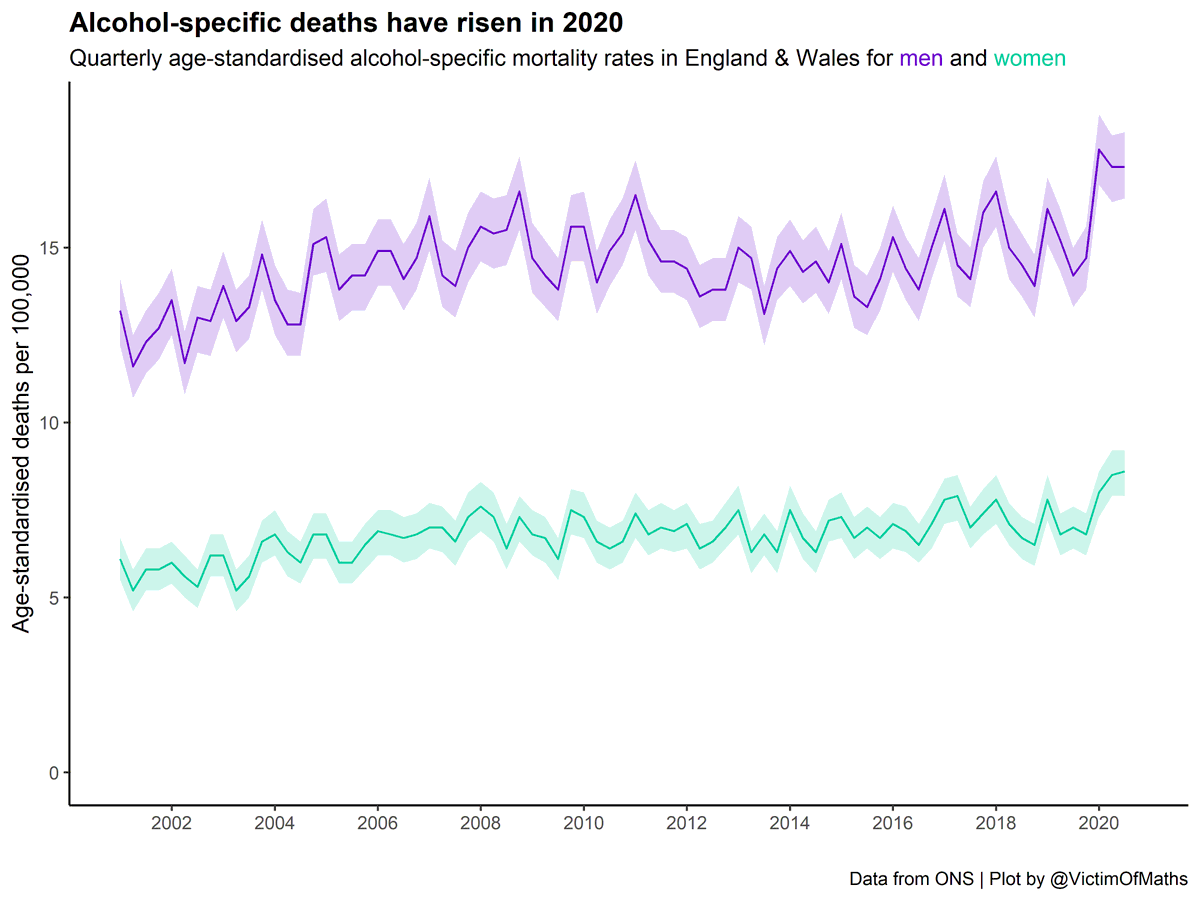
Yesterday @ONS released a whole load of data on alcohol-specific deaths in the UK.
This included their 'normal' data for the period up to 2019 and also provisional figures for the first three quarters of 2020.
As promised, here's a thread with my take on these figures...
This included their 'normal' data for the period up to 2019 and also provisional figures for the first three quarters of 2020.
As promised, here's a thread with my take on these figures...
Firstly, some context.
Alcohol-specific deaths refer to all deaths from a specific, narrow, set of causes, which are *only* cause by alcohol. Things like alcoholic liver disease and alcohol poisoning.
Alcohol-specific deaths refer to all deaths from a specific, narrow, set of causes, which are *only* cause by alcohol. Things like alcoholic liver disease and alcohol poisoning.
This means that all of the deaths in this data were caused by alcohol, but not all deaths caused by alcohol are in this data.
Deaths from causes such as cancer where alcohol increases your risk, but that you can still die from without drinking are excluded.
Deaths from causes such as cancer where alcohol increases your risk, but that you can still die from without drinking are excluded.
Let's start with the data up to 2019.
The top line figure is that overall, alcohol-specific deaths fell in 2019. Though not by much.
Overall alcohol-specific deaths (ASD) rose sharply until 2008, fell until 2012 and have been rising slowly since.
So this is cautious good news.
The top line figure is that overall, alcohol-specific deaths fell in 2019. Though not by much.
Overall alcohol-specific deaths (ASD) rose sharply until 2008, fell until 2012 and have been rising slowly since.
So this is cautious good news.
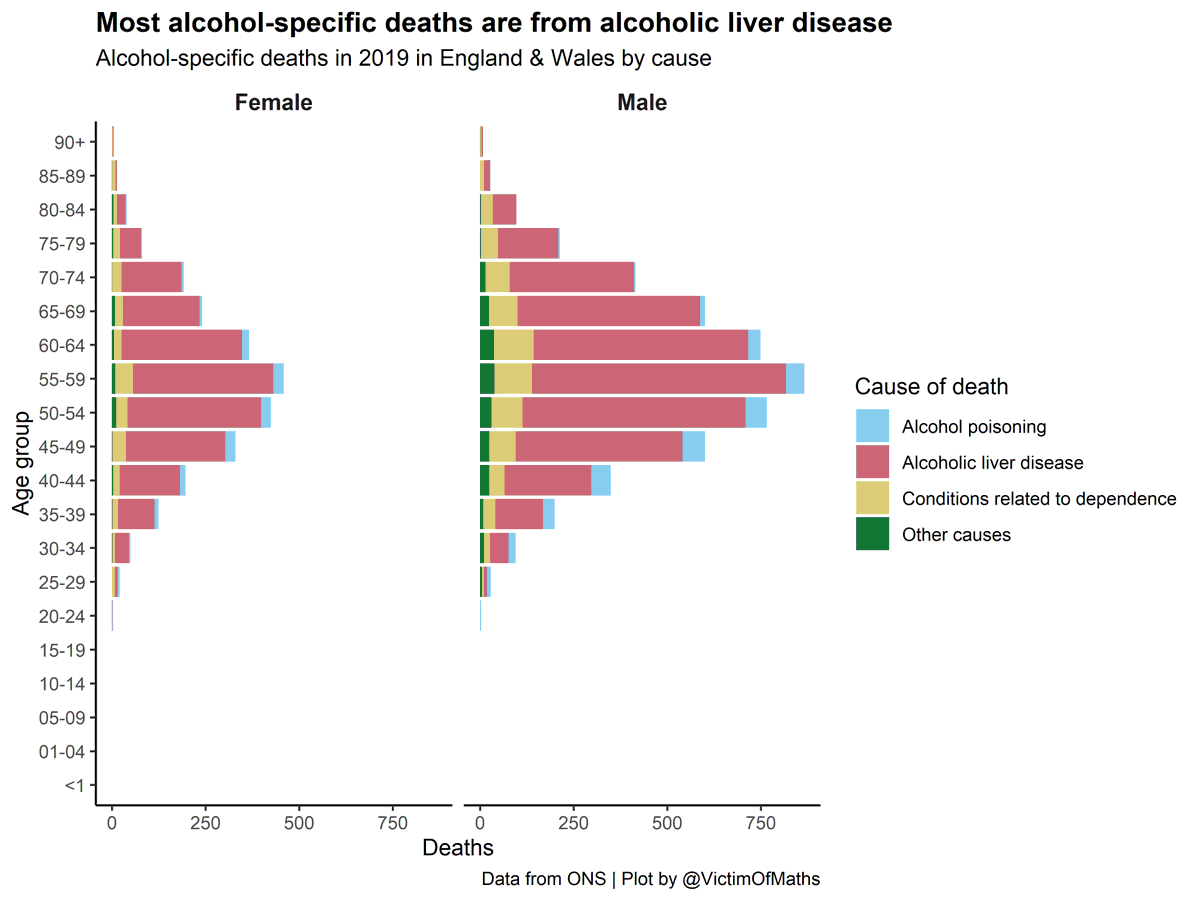
ASD rates are roughly twice as high in men as in women, although the fall in the last year or two of data is more pronounced in men.
The vast majority of ASD are from alcoholic liver disease and these deaths tend to happen in people's 50s and early 60s. Indeed, liver disease is one of the leading causes of death for people of working age.
There have been some quite big shifts in the age patterns of ASD over the past two decades in the UK, with the rise in deaths at older ages being particularly striking.
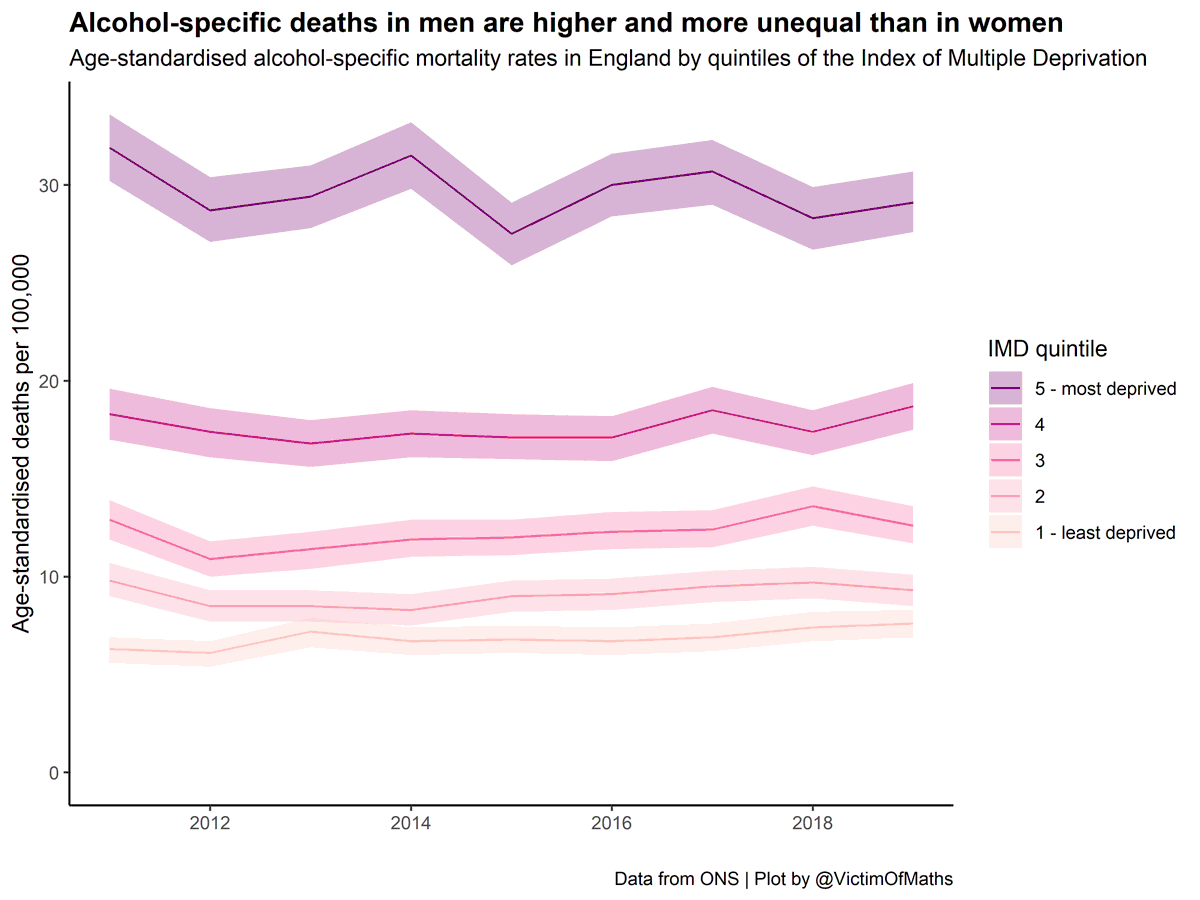
Unsurprisingly, although depressingly, ASD rates are very strongly linked to socioeconomic deprivation, particularly for the most deprived group. This inequality is even greater among men than women.
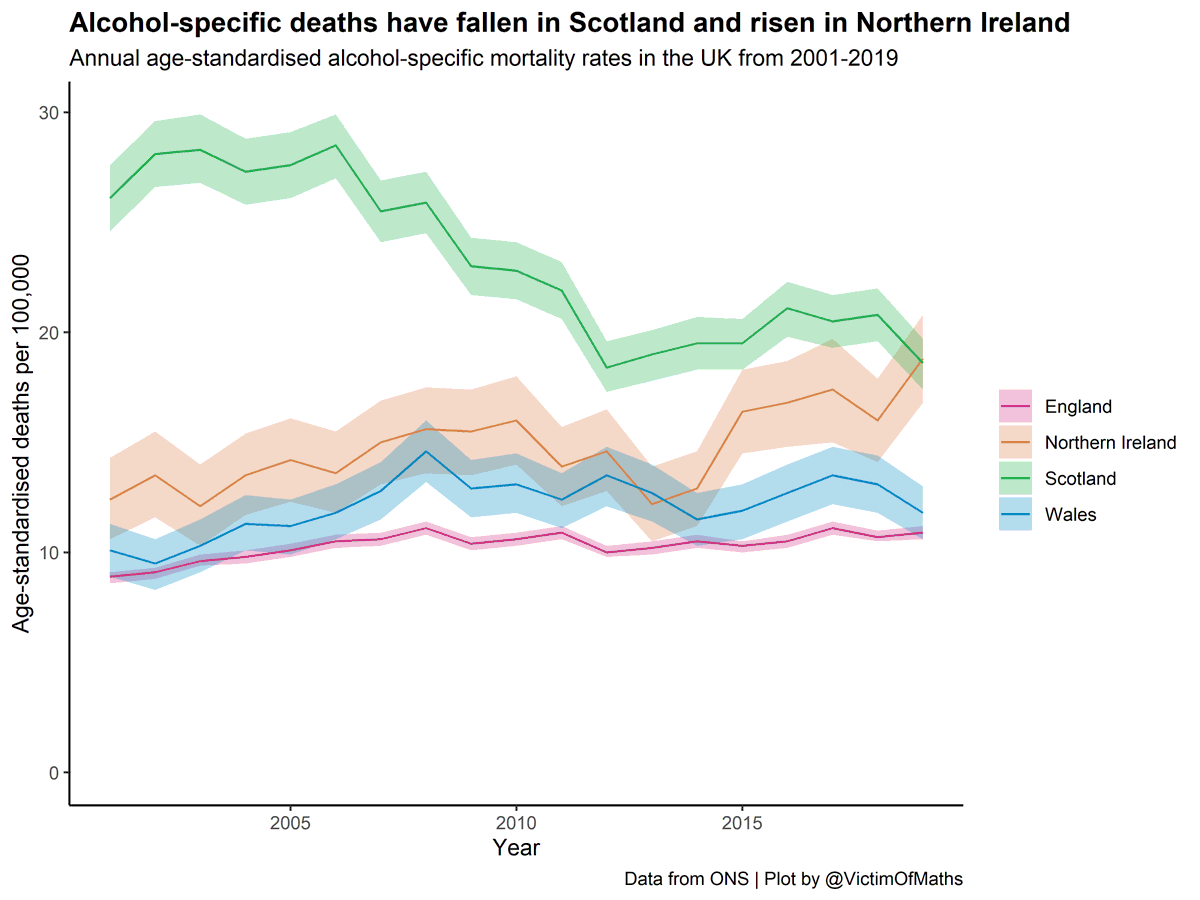
There are some interesting differences between the UK countries. 2019 is the first year we have data for that Scotland hasn't had the highest ASD rate in the UK.
The fall in Scottish ASD rates is welcome, but the rise in Northern Ireland is pretty concerning.
The fall in Scottish ASD rates is welcome, but the rise in Northern Ireland is pretty concerning.
I've previously written about the fall in ASD in Scotland in 2019 and how this might relate to their introduction of Minimum Unit Pricing for alcohol the previous year, if you're interested: https://www.alcohol-focus-scotland.org.uk/news/alcohol-deaths-and-minimum-unit-pricing/
OK, this is all interesting, but the *really* interesting question is what the 2020 data tells us. There have been quite a few alarmist stories about people's drinking increasing during lockdown, (although the picture is complex http://www.ias.org.uk/Blog/What-has-2020-done-to-the-UKs-alcohol-consumption.aspx)...
...so did changes in drinking during the pandemic translate into changes in alcohol-specific mortality?
The headlines say that they did - there was a 16% increase in ASD in the first 3 quarters of 2020 compared to 2019.
But were these lockdown-related?
The headlines say that they did - there was a 16% increase in ASD in the first 3 quarters of 2020 compared to 2019.
But were these lockdown-related?
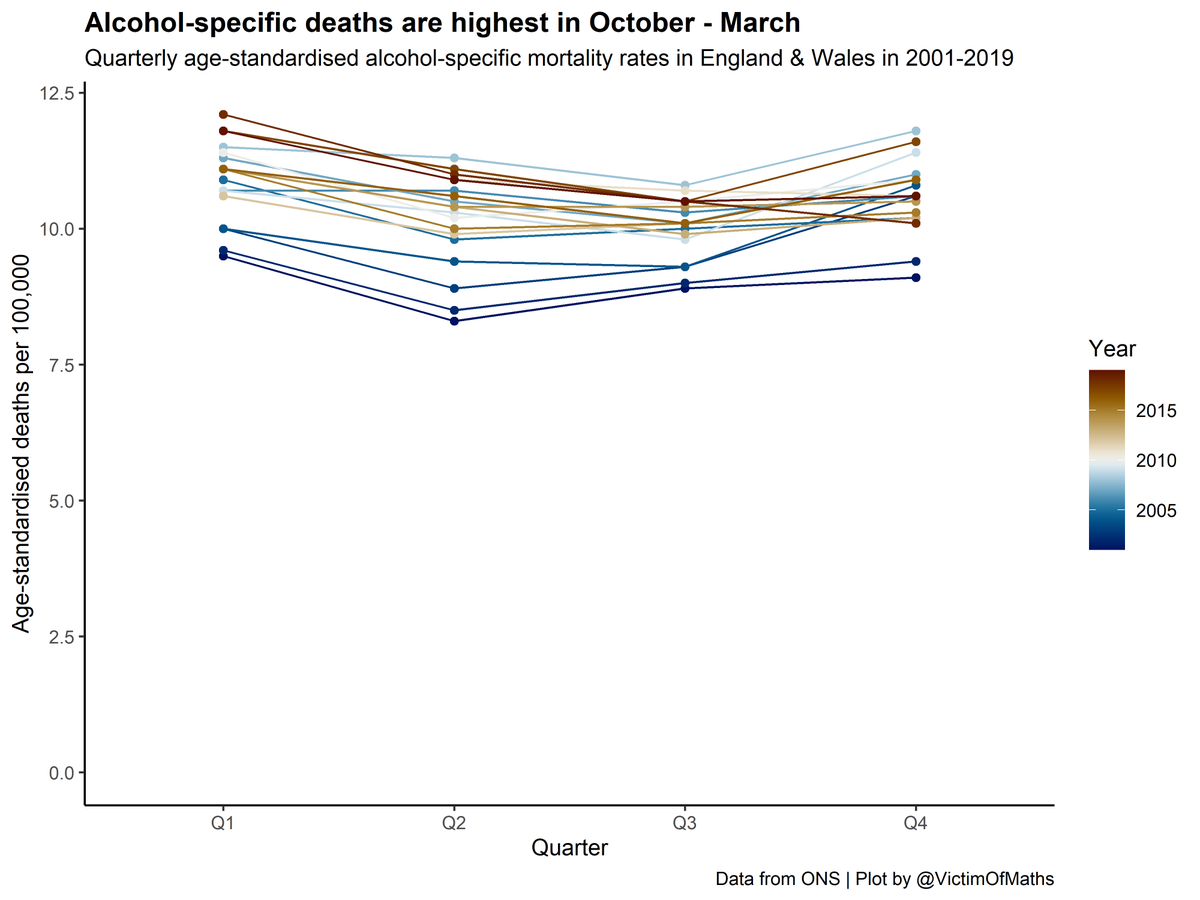
First, it's worth establishing that typically ASD rates are highest in Q1 (Jan-Mar) and Q4 (Oct-Dec) and fall in the Spring/Summer.
The new figures show that alcohol-specific deaths in Q1 in 2020 were at a record high even *before* lockdown, but that they then remained at almost exactly this same level across the following 6 months.
It's hard to interpret this as anything other than an impact of the pandemic
It's hard to interpret this as anything other than an impact of the pandemic
Just in case anyone is going "Ah, but were these changes significant?", here's the same plot with 95% Confidence Intervals on each year.
So yes, very significant.
So yes, very significant.
Interestingly, we don't see the same pattern across all age groups. The increase in alcohol-specific deaths in 2020 seems to have been concentrated in ages 40-69, the groups which had the highest rates to start with.
There are also some interesting regional variations within England & Wales. The biggest increases in ASD in 2020 has been in the North East, the area with the highest rates in previous years. The increase is rather less clear in some other parts of the country.
We have to be a little careful not to overinterpret these figures, for several reasons:
1) The data is provisional. There can be significant delays in registering some deaths, which means these numbers will present an incomplete picture. So the truth may be (slightly) worse.
1) The data is provisional. There can be significant delays in registering some deaths, which means these numbers will present an incomplete picture. So the truth may be (slightly) worse.
2) When we start breaking quarterly data down by age, or region, the actual numbers start to get small, so we'd expect the patterns to be noisier. But there is a fairly consistent story, which gives us more confidence it is the 'true' picture.
Another useful corroborating factor is the fact that the excellent weekly excess mortality reports that PHE produce have shown an 11% increase in deaths from Cirrhosis and other liver disease since the start of the pandemic https://fingertips.phe.org.uk/static-reports/mortality-surveillance/excess-mortality-in-england-latest.html#cirrhosis-and-other-liver-disease
One interesting aspect of the PHE figures (which also include deaths from non-alcoholic liver disease) is that the excess mortality is fairly steady over time. There isn't a clear impact of a 'lockdown' effect.
To finish up, one big question here is *why* we are seeing these increases. It's tempting to see them as reflecting an increase in drinking, and that's certainly very possible. But the wider effects of the pandemic also mean that some heavy drinkers will have found it...
...much harder to access specialist alcohol treatment and support services (if they could access them at all). We've also seen a bit shift in people's willingness to access healthcare services, out of fear of COVID and perhaps their ability to access them...
...You might not be able to get an ambulance to help you with acute consequences of alcoholic liver disease if the ambulances are all busy picking up COVID patients and the hospital has no free beds, for example...
..So it is very possible that this increase in deaths reflects the changes to NHS and non-NHS services as much or more than a change in actual drinking behaviour. It's almost impossible to know at this stage, and we may well never know.
But in another sense, maybe it doesn't matter. Every alcohol-specific death is a tragedy and an increase in these deaths is something to be concerned about, whatever the underlying reason for it.
/ENDS
/ENDS
All R code for the plots in this thread is here: https://github.com/VictimOfMaths/DeathsOfDespair/blob/master/ASDUK.R

 Read on Twitter

