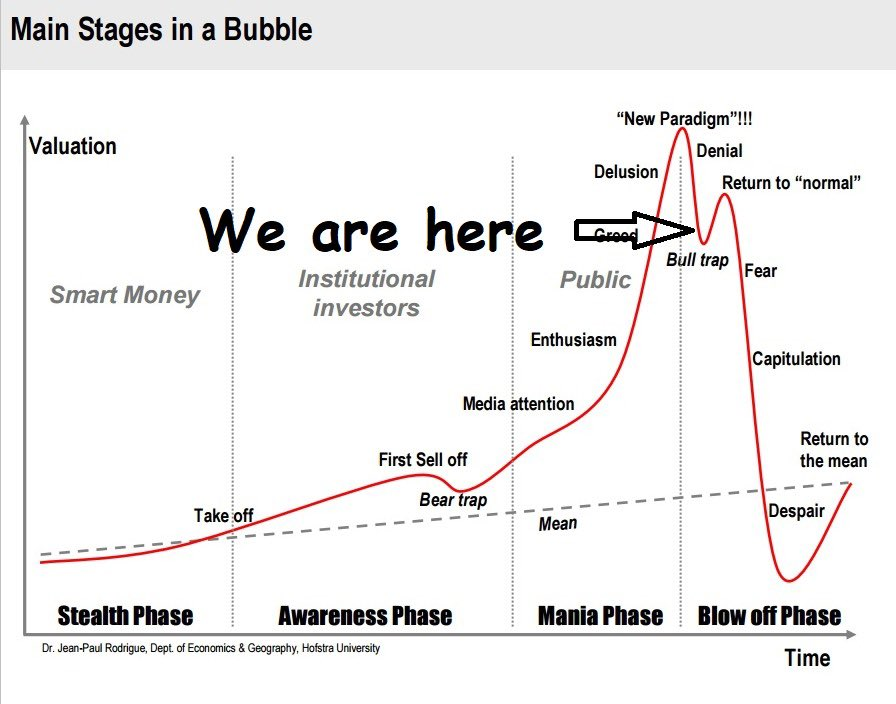
I predict that we'll see a pretty intense bounce on $GME and the other meme stonks. This pattern is so common it's in the classic bubble chart. I believe we're nearing the bottom of the trough as below:
1/6
1/6
With $GME and the meme stonks I believe there's some possibility for the bounce to be rather intense due to the famous short interest. As @alphatrends pointed out "emotions go both ways in the market"
(buy this book!)
6/7
(buy this book!)
6/7
Clues about a bottom:
- Daily range compression
- Doji candle (or long wicks) from a battle between buyers & sellers
- Precrash AVWAPs price range
- 3-5 days after peak
- High SI ;)
There is of course the risk of no bounce!
(And this is obviously a risky thing to trade!)
7/7
- Daily range compression
- Doji candle (or long wicks) from a battle between buyers & sellers
- Precrash AVWAPs price range
- 3-5 days after peak
- High SI ;)
There is of course the risk of no bounce!
(And this is obviously a risky thing to trade!)
7/7
Current $GME chart (last price $85.20 in afterhours)
Counterpoint: looking at the $VW chart there was no second peak after the top
Still believe in a $GME bounce due to speculation whereas $VW was orchestrated by Porsche hence crowd psychology was not a significant factor
(or perhaps the REAL squeeze hasn't happened yet )
)
Still believe in a $GME bounce due to speculation whereas $VW was orchestrated by Porsche hence crowd psychology was not a significant factor
(or perhaps the REAL squeeze hasn't happened yet
 )
)

 Read on Twitter


