Today's COVID vaccination update:
- Total doses administered: 988,202
- New reported today: 12,710
- Doses given per 100 people: 2.6
- Doses available per 100 people: 3.0
Source: https://covid19tracker.ca/vaccinationtracker.html
- Total doses administered: 988,202
- New reported today: 12,710
- Doses given per 100 people: 2.6
- Doses available per 100 people: 3.0
Source: https://covid19tracker.ca/vaccinationtracker.html
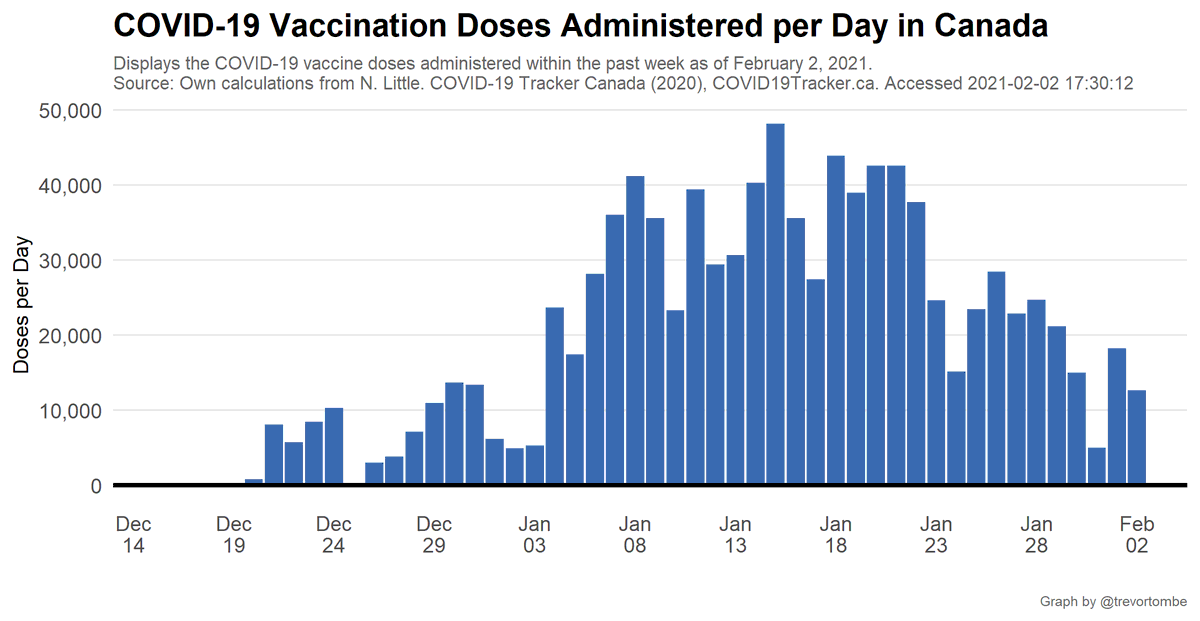
Regarding the pace of vaccination, here's the doses administered per day. Today's amount of 12,710 compares to an average of 17,107 per day over the past week and 30,686 per day the week prior.
In total, Canada is up to 988k doses administered, which represents 2.60% of Canada's population. This is out of a total of 1,153k vaccine doses available. Of those receiving at least one dose, at least 121k have received two (i.e., are fully vaccinated).
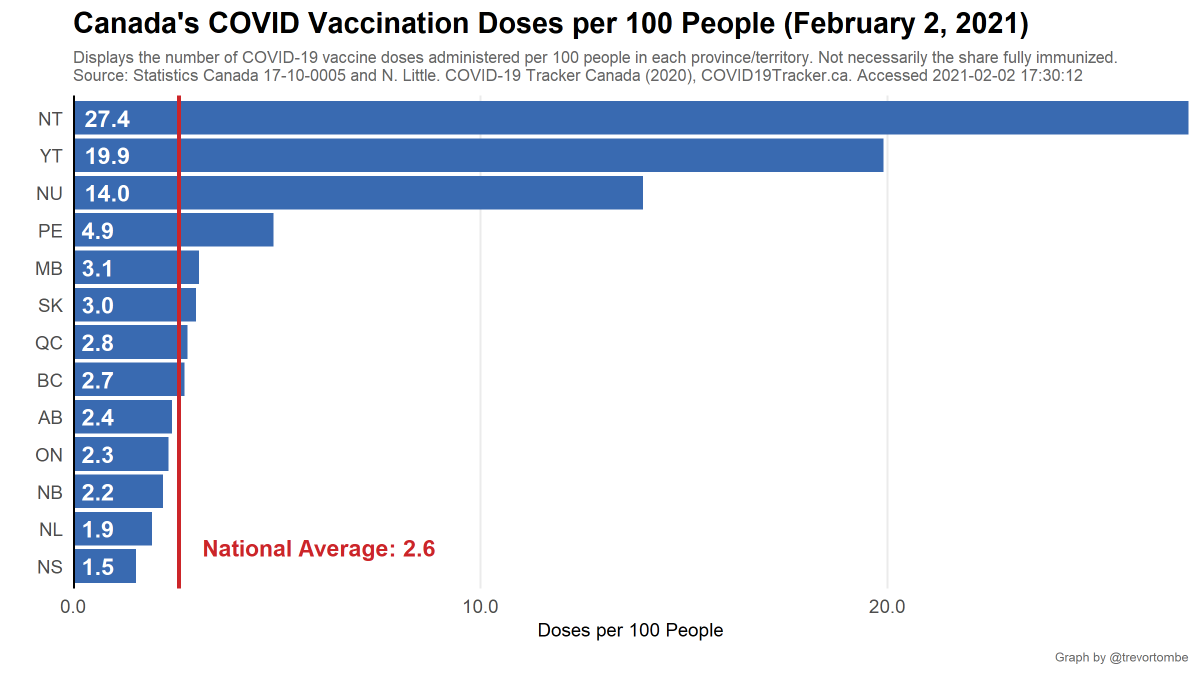
Turning to regions within Canada, here's the latest for each province and territory:
- Highest doses administered per 100 people: NW Terr. at 27.4
- Lowest: NS at 1.5
- Highest doses administered per 100 people: NW Terr. at 27.4
- Lowest: NS at 1.5
Each province has seen different rates of progress over time. Here are vaccination rates for provinces (aggregating Atlantic) to illustrate this.
Provinces administer, Feds distribute. Here's the fraction of doses delivered that have been administered. SK leading with 108.7% of delivered doses administered while NU has administered 45.9%.
Note: Shares >100% are due to squeezing 'extra' doses from vaccine vials.
Note: Shares >100% are due to squeezing 'extra' doses from vaccine vials.
How does Canada compare to others? Currently, Canada ranks 20 out of the 30 OECD countries with data reported.
Source: https://ourworldindata.org/covid-vaccinations + the above. (Note: Not all countries are updated to the same date.)
Source: https://ourworldindata.org/covid-vaccinations + the above. (Note: Not all countries are updated to the same date.)
Finally, a Canada/US comparison:
- Highest Prov: PE at 4.9 per 100 people
- Lowest Prov: NS at 1.5
- Highest State: AK at 16.9
- Lowest State: ID at 7.1
- Top CDN Terr: NT at 27.4
- Top US Terr: AS at 19.3
Sources: https://covid.cdc.gov/covid-data-tracker/#vaccinations and https://covid19tracker.ca/vaccinationtracker.html
- Highest Prov: PE at 4.9 per 100 people
- Lowest Prov: NS at 1.5
- Highest State: AK at 16.9
- Lowest State: ID at 7.1
- Top CDN Terr: NT at 27.4
- Top US Terr: AS at 19.3
Sources: https://covid.cdc.gov/covid-data-tracker/#vaccinations and https://covid19tracker.ca/vaccinationtracker.html
NOTE: Making these graphs is easy (and mostly automated). Gathering and hosting the data is hard, and only possible thanks to Noah Little and other volunteers at @covid_canada ( https://covid19tracker.ca/index.html ).
If you can, consider supporting their work at https://ko-fi.com/covid19trackerca
If you can, consider supporting their work at https://ko-fi.com/covid19trackerca

 Read on Twitter


