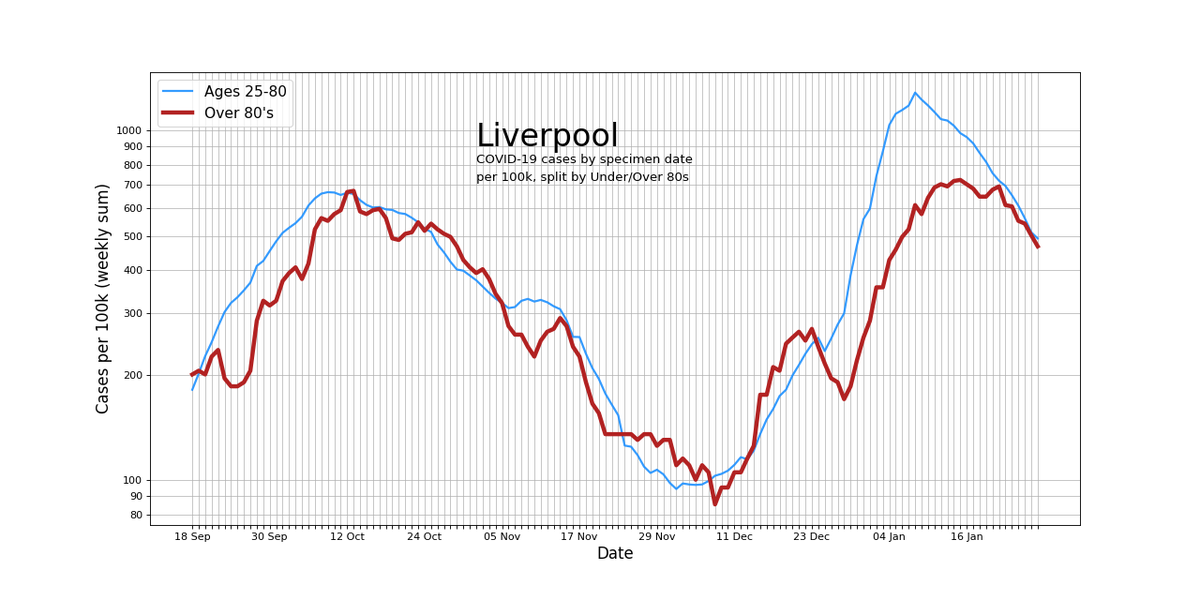
So I’ve pretended to play mathematician briefly & do one of those simple model thingies that is all the hype these days but for Liverpool only
Basically by plotting the case numbers on a log scale and doing a fit you get a potentially interesting scenario for the medium term
1/
Basically by plotting the case numbers on a log scale and doing a fit you get a potentially interesting scenario for the medium term
1/
Only a handful of people read these tweets, but if that is you I'd like to politely request you don't quote/retweet any of this because it's not to be taken serious
Simply just food for thought given current situation that I can come back to in 1/2 weeks & evaluate :) 2/
Simply just food for thought given current situation that I can come back to in 1/2 weeks & evaluate :) 2/
So Tiering 2 in Dec made R>1. Coupling this with Yuletide mixing plus <enter your favourite post-Christmas epidemiology stuff here> followed by restrictions meant that for Liverpool the 7-day average cases by spec date peaked sharply on 8th Jan 3/
Cases started to fall and the Master of Log's @BristOliver dropped a mathsy thread on what trends we might expect to see in England case numbers due to different degrees of effectiveness of the vaccine & it's roll-out 4/ https://twitter.com/BristOliver/status/1353270202151153664?s=20
Immediately I jumped to the Liverpool data.
So 9 days from the peak passed and I did what the thread told me to do and plot a straight line on the log graph, because it looked straight!
5/
So 9 days from the peak passed and I did what the thread told me to do and plot a straight line on the log graph, because it looked straight!
5/
More data came through & cases fell even quicker than that trend line, wtf
But in @BristOliver 's thread above he makes the point that if there's some intervention helping to push R down further (like vaccines), should see something like a quadratic 6/
https://twitter.com/BristOliver/status/1353616031898591232?s=20
But in @BristOliver 's thread above he makes the point that if there's some intervention helping to push R down further (like vaccines), should see something like a quadratic 6/
https://twitter.com/BristOliver/status/1353616031898591232?s=20
In an open discussion on this bird app @JamesWard73 was throwing banging idea after banging idea and dropped this thread
Basically looks at potential case that vaccines are pushing R down in the over 80's age group and shows this with math 7/ https://twitter.com/JamesWard73/status/1355922171344908298?s=20
Basically looks at potential case that vaccines are pushing R down in the over 80's age group and shows this with math 7/ https://twitter.com/JamesWard73/status/1355922171344908298?s=20
So obviously I fitted a quadratic to the data points, and for the last few days now the data seems to be holding up to the trend quite well!
8/
8/
So what's the point:
*Something* is pushing the R number in Liverpool down with each day.
The curved slope on the log plot (black) means cases are falling faster than if R < 1 but constant (purple).
9/
*Something* is pushing the R number in Liverpool down with each day.
The curved slope on the log plot (black) means cases are falling faster than if R < 1 but constant (purple).
9/
I'm not going to speculate what is doing the pushing ( @JamesWard73 makes a good case for why).
But given we know the equation of the fit you can peek into the future to see what would happen if real life sticks to the current trend...
On a log plot it is this:
10/
But given we know the equation of the fit you can peek into the future to see what would happen if real life sticks to the current trend...
On a log plot it is this:
10/
On a log plot, can clearly see how much faster case numbers go down in the quadratic trending situation (black) compared to boring linear (purple)
For context, the red line is when L'pool got placed into Tier2 (R>1 shortly after) & blue the controllable levels of summer 11/
For context, the red line is when L'pool got placed into Tier2 (R>1 shortly after) & blue the controllable levels of summer 11/
Change the y-axis from log to boring linear, more like the graphs you see on TV, & Liverpool could reach 10 cases a day before the end of February (black)
In contrast to this level being achieved sometime in April if that *something* wasn't pushing R down
12/
In contrast to this level being achieved sometime in April if that *something* wasn't pushing R down
12/
I know I said I didn't want to speculate what that *something* could be, pushing down R, because I have no idea
But I do think for Liverpool it is not vaccines atm...I'll make another tweet later but I don't see any clear signals (yet) in the log plot of the >80's age group
13/
But I do think for Liverpool it is not vaccines atm...I'll make another tweet later but I don't see any clear signals (yet) in the log plot of the >80's age group
13/
I'm probably just getting a bit excited that this stuff shows a potential for pubs to open at a slightly earlier date. So wont be surprised if tonight's data point will just be crazy high & ruin everything
Will revisit this in 1 or 2 weeks to see what actually happened..
14/
Will revisit this in 1 or 2 weeks to see what actually happened..
14/
For the handful of people who have made it this far, I can't recommend enough following @BristOliver @JamesWard73 @jburnmurdoch @VictimOfMaths @theosanderson etc
They're dissecting the vaccine effectiveness UK situation in open conversations on this app & it's mind blowing 15/15
They're dissecting the vaccine effectiveness UK situation in open conversations on this app & it's mind blowing 15/15

 Read on Twitter


