1/ Why the Fed won’t say that we are in a bubble…
…despite all the evidence seemingly pointing to the fact that we are.
[THREAD]
…despite all the evidence seemingly pointing to the fact that we are.
[THREAD]
2/ Bubble – yes?
Over the last few months, financial media has been rife with talk of the latest bubble to hit the stock market.
Over the last few months, financial media has been rife with talk of the latest bubble to hit the stock market.
3/ Narratives are found every day to explain the market’s movement, but it sometimes seems the easiest explanation is that ‘Stocks Always Go Up’, as they invariably do.
Market commentators point to various indicators to justify their call that we are in a bubble.
Market commentators point to various indicators to justify their call that we are in a bubble.
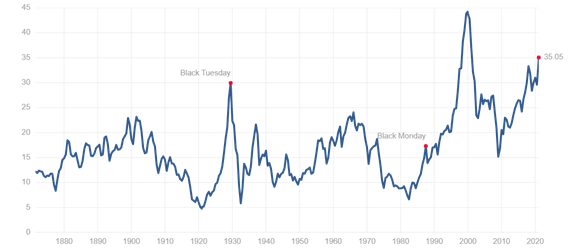
4/ Let us take a look at the Shiller PE ratio, a measure also known as the CAPE Ratio which stands for Cyclically Adjusted PE Ratio. It is based on the real, or inflation-adjusted, EPS over a 10-year timeframe to remove cyclical effects of the business cycle.
5/ In 2000, during the years of the Dot-com bubble, this ratio topped out at 44.19. It is currently at 35.05, the highest since then. Using this metric, it is fairly obvious that we are getting frothy, if not in a proper bubble.
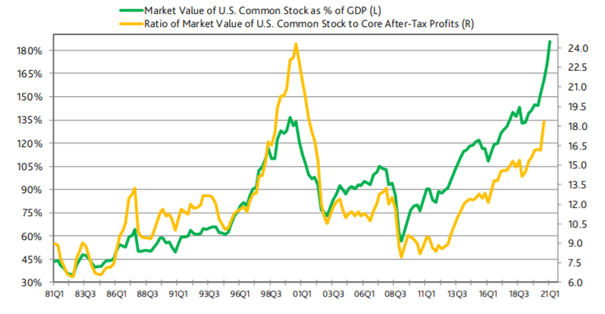
6/ Let us look at one more metric – Market value of US common stock as a % of GDP. The market value of US common stocks reached $40 trillion for the first time ever, which is a record 185% of GDP.
7/ Even during the Dot-com bubble, the market only reached 137% of GDP, which was a record back then.
8/ So, we have looked at two valuation measures which clearly shows that we are at extremely elevated levels.
9/ There are numerous other measures that we could have looked at, for example technical analysis of the S&P highlighting how stretched we are; a look at the S&P PE Ratio; or the S&P Price to Sales Ratio, which is also at record highs – amongst others.
10/ One doesn’t need to look much further to see evidence of frothiness- videos posted on TikTok boasting about >10% daily returns, market moving up even when economic data misses to the downside, abbreviations such as BTFD and FOMO thrown around, Nasdaq up 100% since its lows…
11/ …in March and the stock everyone loves to talk about – Tesla – trading at a PE Ratio of 1,626 and 200x consensus 2021 earnings, and market cap of over $800bn despite only turning profitable in the last year and a half.
12/ According to a recent survey by Deutsche Bank, 89& of investors thought the financial markets are in bubble territory.
13/ Bubble – no?
Ok, so it looks like we are in a classic bubble. So, the obvious question is, why hasn’t the Fed tried to step in to dampen down investor exuberance?
Ok, so it looks like we are in a classic bubble. So, the obvious question is, why hasn’t the Fed tried to step in to dampen down investor exuberance?
14/ In the December FOMC meeting, Powell said, “If you look at P/Es they’re historically high, but in a world where the risk-free rate is going to be low for a sustained period, the equity premium, which is really the reward you get for taking equity risk, would be what you’d…
15/ …look at. Admittedly P/Es are high but that’s maybe not as relevant in a world where we think the 10-year Treasury is going to be lower than it’s been historically from a return perspective”.
Let us unpack this statement.
Let us unpack this statement.
16/ He is basically saying that once you take into account interest rates, stock prices are not actually at overpriced as they look.
17/ Equity risk premium refers to the extra return that an investor desires to get from equities over the expected returns on government debt, which is a risk-free asset.
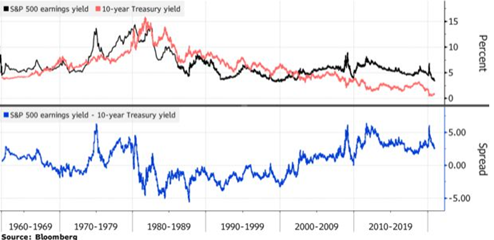
18/ Now we need to look at the earnings yield on the S&P 500 and the yields on US Government securities. To find the earnings yield, we just invert the Shiller PE ratio, a metric described above.
19/ We are going to look at nominal rates, rather than real rates, on the US 10-year bonds.
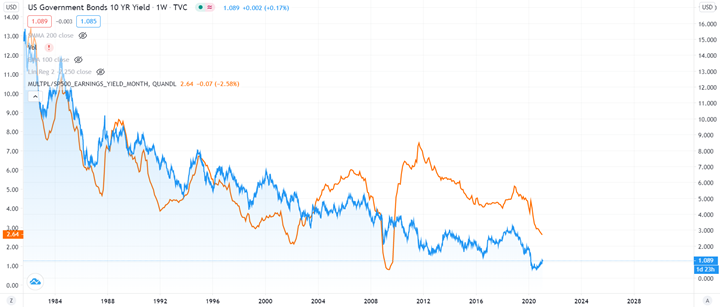
20/ Below, we first show what the situation looked like when Powell said those comments back in December. We can see that the spread, earnings yield – 10yr Tsy yields, is far above where it was in 2000. Back then, bonds yield were higher than yields on equities.
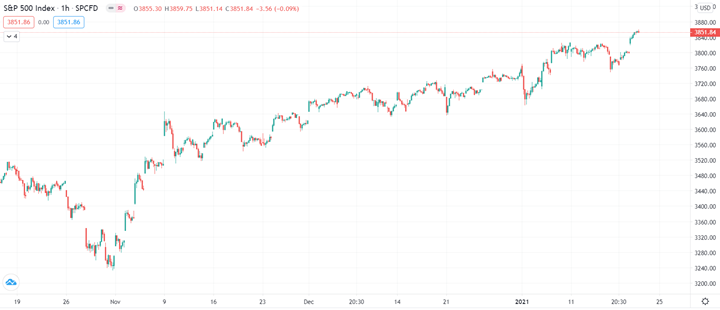
21/ Let us have a look at how things stand today. Since then, stocks have continued to move higher, from 3,680 to 3,850.
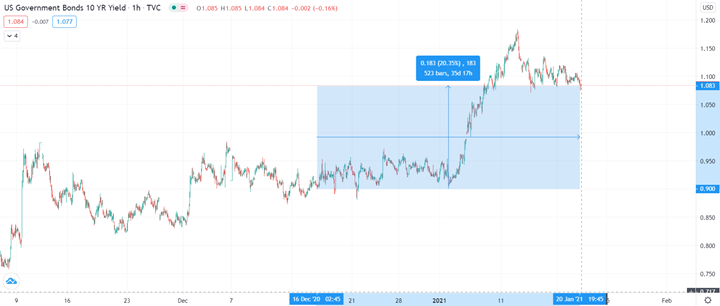
22/ Similarly, in December, yields on the 10YR US Gov Bonds stood at just over 0.90%. But since then, bond prices have dropped across the long-end of the curve and the 10-year yield is currently at 1.08%, an increase of over 20%.
23/ This is how the spread looks right now. As you can see, during the internet bubble, yields on bonds were higher, yet stocks were roaring higher. In recent weeks, yields have crept up and the earnings yields have dropped lower.
24/ Whilst the S&P 500’s earnings yield is still higher than the yield on 10yr bonds, the spread has come in.
25/ Since bond yields are so low, where else are investors meant to seek an alluring return? Why should they not buy stocks, which yield almost 2.5& more than bonds do?
26/ This has given rise to the acronym ‘TINA’, There Is No Alternative – ie no alternative other than to buy stocks. In effect, falling bond yields support US stock prices.
27/ This comparison which the Fed use as their valuation/market-exuberance model has thus helped them to defend against the soaring stock markets.
28/ Despite the millions unemployed, a pandemic raging and businesses ravaged, this disconnect between the stock market and the ‘real economy’ looks set to continue for now.
29/ There is a lot more to say about this topic and there are several caveats and arguments to this, but those can be explored later.
30/ I wrote the above thread as an article about a week and a half ago. Since the S&P has dropped slightly and bond yields are largely unchanged, so the points still stand.
31/ As always, please follow, like, RT or comment if you have any thoughts on what I've said.
Thank you for reading.
Thank you for reading.

@threadreaderapp unroll

 Read on Twitter