Using data from the Pro14 I take a look at which stats correlate most strongly with scoring points.
For those new to stats the number is the R-Squared. This indicates how strongly the variable (tries, defenders beaten, clean breaks etc) correlates with points scored.
1)
For those new to stats the number is the R-Squared. This indicates how strongly the variable (tries, defenders beaten, clean breaks etc) correlates with points scored.
1)
A value of 1 would indicate perfect correlation. Such as between your age and the number of birthdays you have had; as one rises the other rises. A value of 0 would be something completely unrelated; the number of calories you eat per day and times run in 200m races.
2)
2)
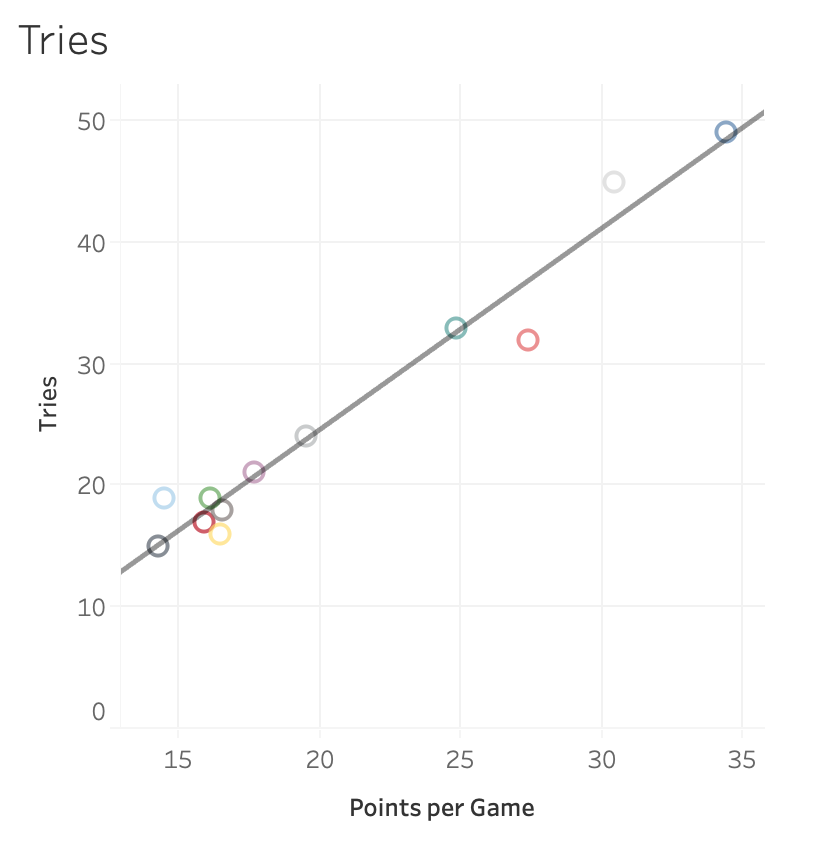
Tries - 0.96
There is a near enough perfect correlation between the number of tries you score and the number of points you score.
Not surprising.
3)
There is a near enough perfect correlation between the number of tries you score and the number of points you score.
Not surprising.
3)
Carries - 0.59
Carries, which are a good proxy for possession, are the next best indicator of success. Unlike tries, there is a possibility that the relationship is just caused by chance. This is somewhat surprising given the rising anti-possession lobby.
4)
Carries, which are a good proxy for possession, are the next best indicator of success. Unlike tries, there is a possibility that the relationship is just caused by chance. This is somewhat surprising given the rising anti-possession lobby.
4)
Metres Made - 0.55
People hate metres made, but it has a pretty good correlation with success. For all the talk of the limitations of metres made it works because moving up the pitch is important as this shows.
5)
People hate metres made, but it has a pretty good correlation with success. For all the talk of the limitations of metres made it works because moving up the pitch is important as this shows.
5)
Defenders Beaten - 0.43
We're dropping down to levels where we can't exclude chance being a factor now. But, Defenders Beaten is the fourth best indicator of success and better than clean breaks, 0.4.
6)
We're dropping down to levels where we can't exclude chance being a factor now. But, Defenders Beaten is the fourth best indicator of success and better than clean breaks, 0.4.
6)
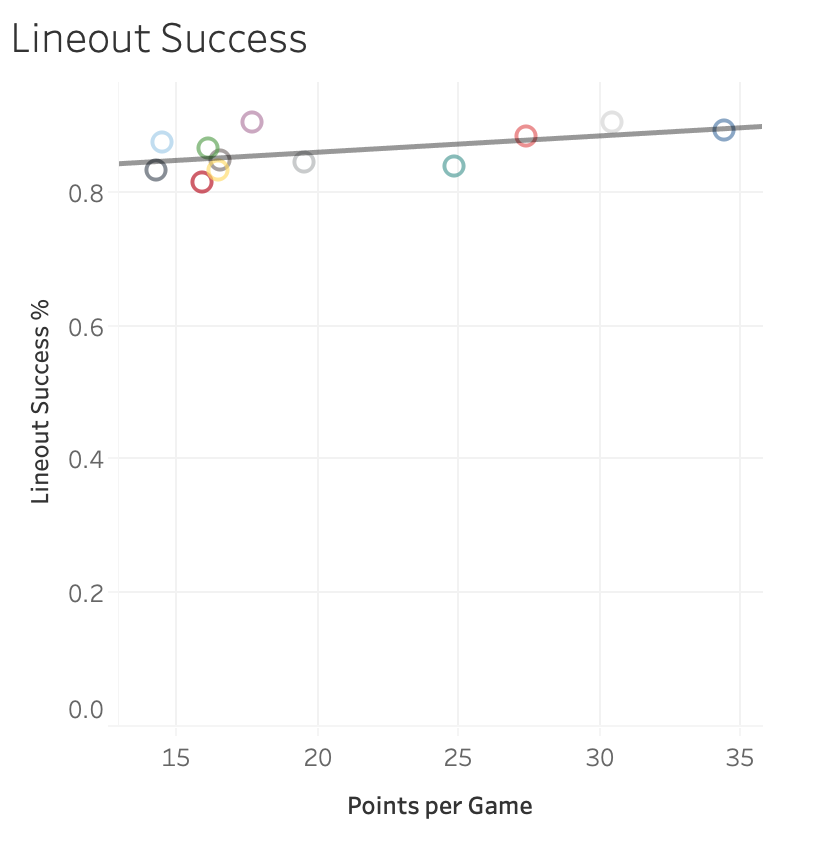
Lineout Success - 0.31
Bizarrely lineout success is a far far bigger indicator than scrum success (0.18) but, of course, at this point it's certainly possible that this could be down to chance. I would imagine that clean lineout ball would be a better indicator.
7)
Bizarrely lineout success is a far far bigger indicator than scrum success (0.18) but, of course, at this point it's certainly possible that this could be down to chance. I would imagine that clean lineout ball would be a better indicator.
7)
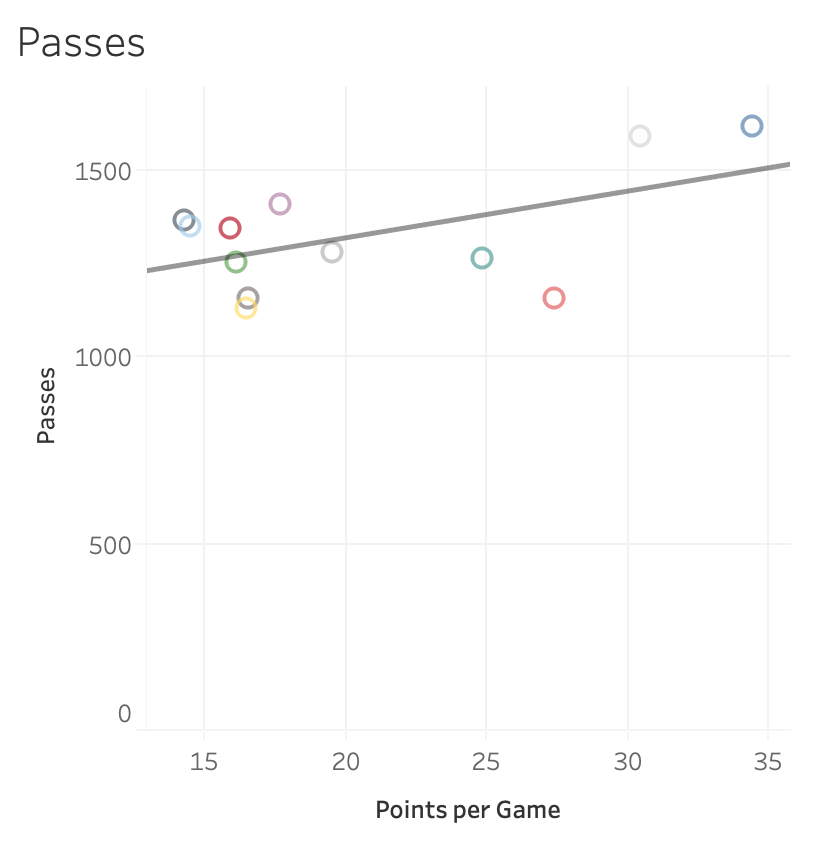
Passes - 0.3
The number of passes is a much worse indicator than the number of carries and offloads, which many consider a strong indicator of success, is lower at 0.23.
8)
The number of passes is a much worse indicator than the number of carries and offloads, which many consider a strong indicator of success, is lower at 0.23.
8)
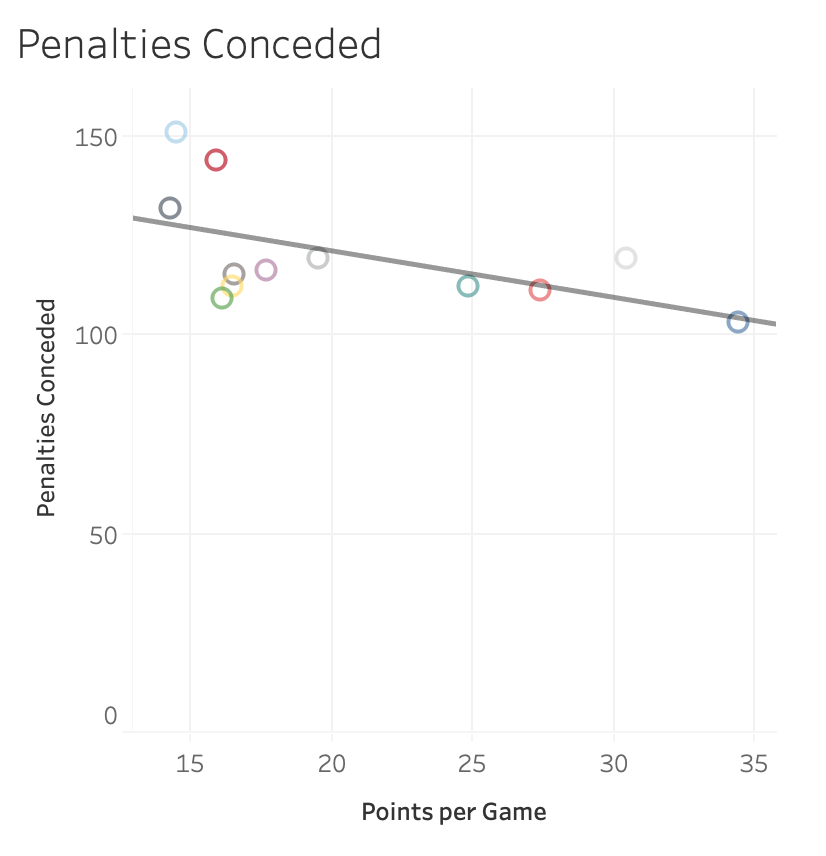
Penalties Conceded - -0.31
This means that has the number of penalties conceded increases the points scored decreases. Still, the number of penalties conceded is still a less good indicator than the number of carries.
9)
This means that has the number of penalties conceded increases the points scored decreases. Still, the number of penalties conceded is still a less good indicator than the number of carries.
9)
Weirdly, the number of penalties scored has a negative correlation to points scored. So the more penalties you score the lower your total number of points.
Take these with a large pinch of salt as they are for less than one season. But still interesting.
10.
Take these with a large pinch of salt as they are for less than one season. But still interesting.
10.

 Read on Twitter


