New paper providing *overall* impact of minimum wages on low-wage employment with Cengiz, Lindner and @dzentlermunro. We use ML to create a demographics-based low-wage group capturing ~75% of all likely min wage workers. https://www.nber.org/papers/w28399#.YBhGmiEqePo.twitter
Builds on our 2019 QJE paper: use an event study approach with 172 min wage changes. In that paper we used frequency distribution changes to look at overall low-wage jobs. Here we use demographic predictors to construct a likely min wage worker group (capturing most of them).
The demog based approach also allows us to look at labor force participation, labor market transitions (in and out of non-employment). We don't find any effects on overall employment, unemployment, or transitions (UE, EU, NE, EN) for likely min wage workers following MW increase.
Important for recruiters! My coauthor @dzentlermunro is on the market this year and is a *phenomenal* economist. Interested in labor, inequality, search+macro.
Check out: https://davidzentlermunro.github.io
Check out: https://davidzentlermunro.github.io
Back to the paper.
It has 2 components.
1) 1st part is purely a prediction exercise. Use demographic features to identify workers earnings at or close to min wage.
2) 2nd part is causal inf: take likely min wage indiv's, use dif-in-dif event study to estimate impact on outcomes
It has 2 components.
1) 1st part is purely a prediction exercise. Use demographic features to identify workers earnings at or close to min wage.
2) 2nd part is causal inf: take likely min wage indiv's, use dif-in-dif event study to estimate impact on outcomes
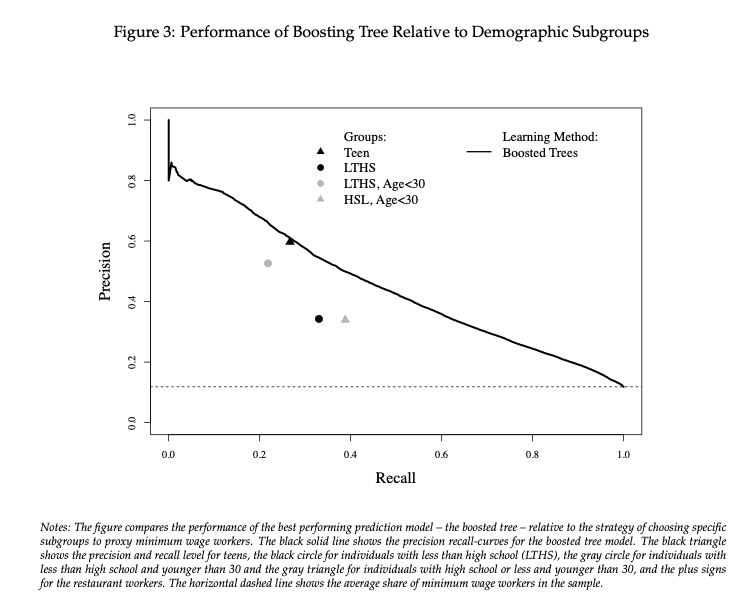
First part: prediction problem. We find that the best prediction model in our case was gradient boosting, but other prediction models perform pretty well (but all do >> basic logit without interactions). Here is the "precision/recall" curve, estimated out of sample.
We can plot the precision/recall of some commonly studied demographic groups in the min wage literature. If you want a "high recall" group (as in capturing most likely min wage workers) we can do a lot better than age/educ based groupings often used.
OK now the second part, causal inference.
172 events of state level min wage changes.
Dif-in-dif design (just like 2019 QJE paper): 3 years before, 5 years after.
172 events of state level min wage changes.
Dif-in-dif design (just like 2019 QJE paper): 3 years before, 5 years after.
First Q: can we find a clear wage effect? Fig shows estimates from different regressions choosing different cutoffs along precision-recall curve.
Strong, statistically sig, wage effect even when we go up to recall of around 90%. Our baseline "high recall" group is 75% recall.
Strong, statistically sig, wage effect even when we go up to recall of around 90%. Our baseline "high recall" group is 75% recall.
Now, look at same type of figure, but also for employment, unemployment and participation. No noticeable effect on these outcomes for any cutoff.
Obligatory event study figures for these 4 outcomes for (1) high recall group [broad group, 75% of MW workers], (2) high probability group [narrow, high impact, group]. Little impact on any outcome up to 5 years following treatment.
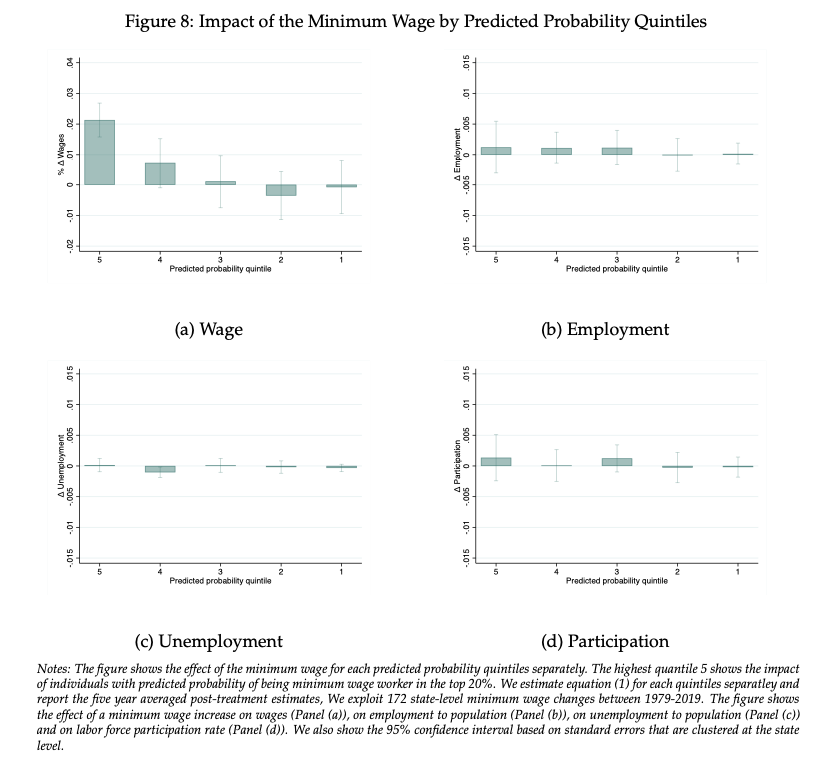
Can look at quintiles of predicted probability (of being MW workers), with upper quintiles (low productivity) being useful falsification. Wage growth at high probability, little at top. Emp/unemp/participn close to zero throughout.
The own-wage elasticity of employment (Emp elasticity w.r.t MW/ Wage elasticity w.r.t. MW) for our high recall group (capturing 75% of MW workers) is 0.18 (s.e. 0.22), ruling out all but modest negative effects, consistent with our QJE paper and my UK review.
A key new finding: we also look at flow outcomes - namely transitions out and into un/non-employment.
E.g., maybe a higher MW means # jobs stay same but becomes harder to find a job if you're out of one.
We find no evidence of that.
E.g., maybe a higher MW means # jobs stay same but becomes harder to find a job if you're out of one.
We find no evidence of that.
We also look at flow (eg., job finding rate) effects for groups with likely greater labor supply response: single mom, married mom, and a "high LFP switch" group constructed using ML. None show any effects, negative or positive.
Take away: using data up to 2019, we are able to construct an "affected group" capturing the vast majority of likely MW workers. Wage effects are strong for this group, but impact on employment, participation and flows in/out of E,N,U are very small (can't reject zero).
\\fin
\\fin

 Read on Twitter


![Obligatory event study figures for these 4 outcomes for (1) high recall group [broad group, 75% of MW workers], (2) high probability group [narrow, high impact, group]. Little impact on any outcome up to 5 years following treatment. Obligatory event study figures for these 4 outcomes for (1) high recall group [broad group, 75% of MW workers], (2) high probability group [narrow, high impact, group]. Little impact on any outcome up to 5 years following treatment.](https://pbs.twimg.com/media/EtKx5jSXEAAB7F7.png)
![Obligatory event study figures for these 4 outcomes for (1) high recall group [broad group, 75% of MW workers], (2) high probability group [narrow, high impact, group]. Little impact on any outcome up to 5 years following treatment. Obligatory event study figures for these 4 outcomes for (1) high recall group [broad group, 75% of MW workers], (2) high probability group [narrow, high impact, group]. Little impact on any outcome up to 5 years following treatment.](https://pbs.twimg.com/media/EtKx5jTW8AcN8pM.png)


