THREAD:
Comparing Rushing vs. Passing Outcome Distributions in Different Situations
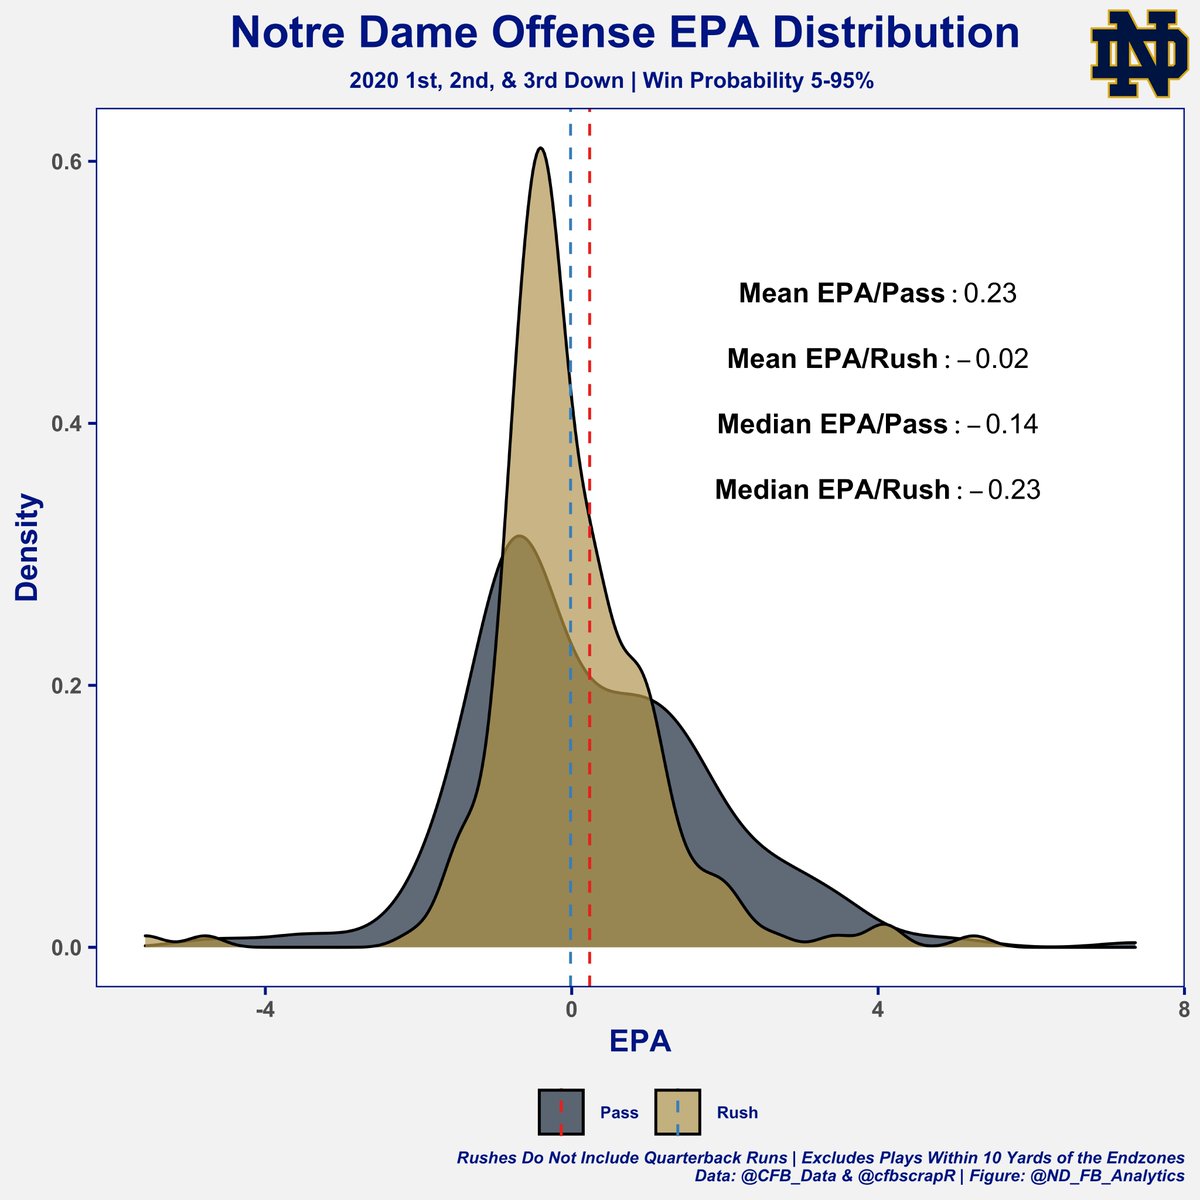
Overall, passing had a wider range of potential outcomes but outperformed rushing due to the higher ceiling (higher mean) and higher floor (higher median)
(See last tweet for viz explanation)
Comparing Rushing vs. Passing Outcome Distributions in Different Situations
Overall, passing had a wider range of potential outcomes but outperformed rushing due to the higher ceiling (higher mean) and higher floor (higher median)
(See last tweet for viz explanation)
The story was the same on 1st & 2nd Downs, although a little less extreme
When over 50% of rushes are resulting in less than -0.29 EPA and 3 or fewer yards, you need to do some serious self-reflection and think if you really are a rushing is really the strength of your offense
When over 50% of rushes are resulting in less than -0.29 EPA and 3 or fewer yards, you need to do some serious self-reflection and think if you really are a rushing is really the strength of your offense
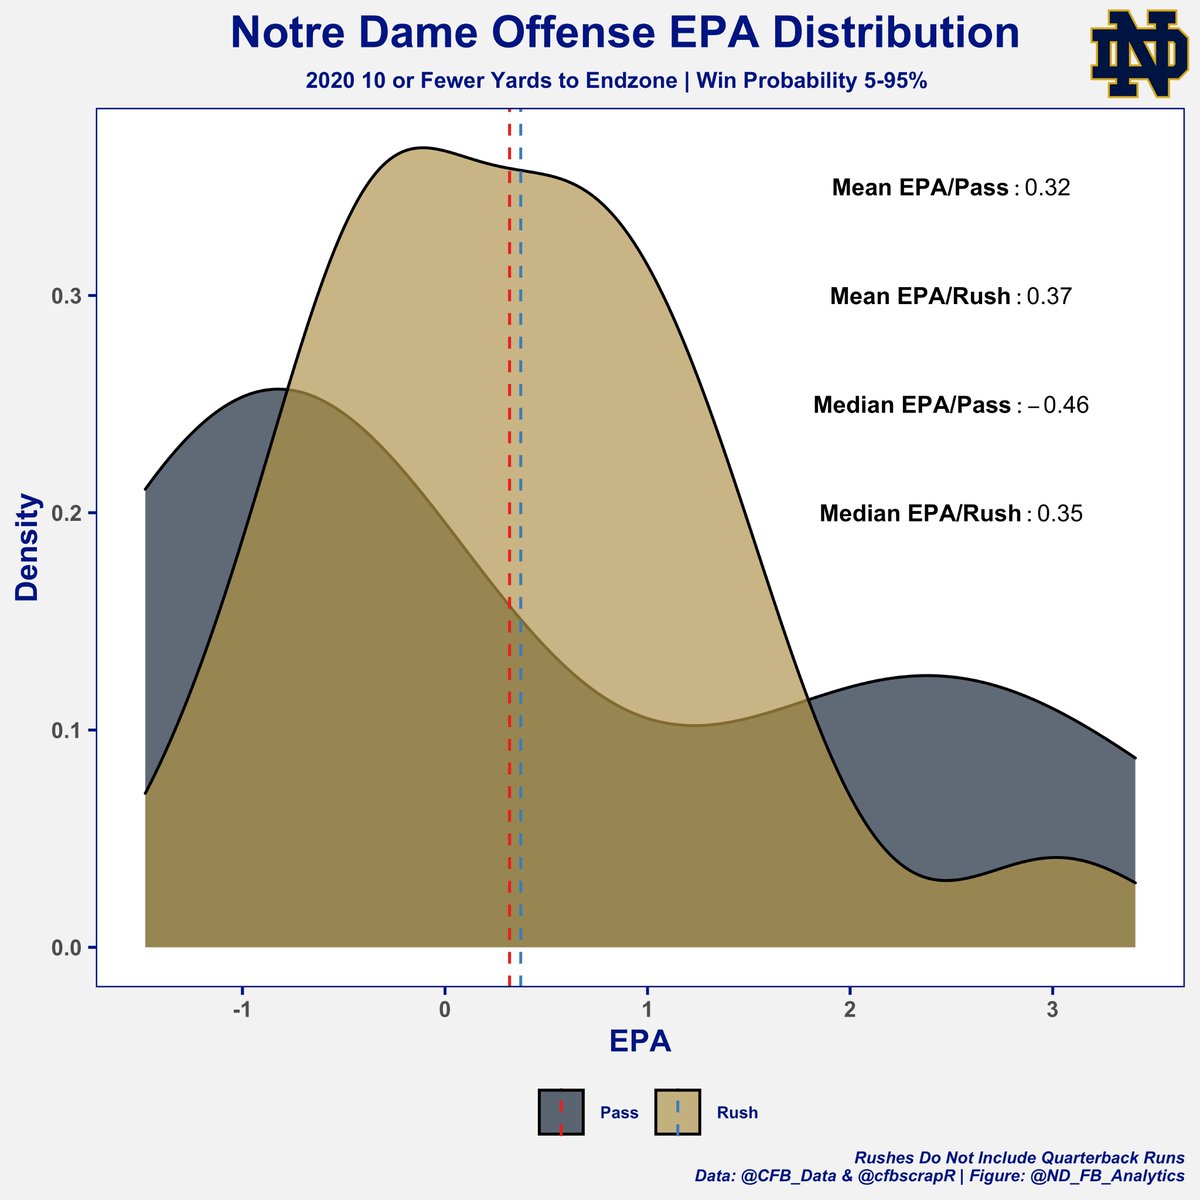
But does this mean there is never a situation where Notre Dame should be rushing more than passing? No! Every down/distance calls for (or at least should) a different philosophy
Within 10 Yards of the End Zone is one such situation, run-heavy with occasional Play-Action mixed in (ACC Championship Game sequence)
This makes sense because YPC is not as important here than the middle of the field, since each yard moves you 10% closer to 6 points
This makes sense because YPC is not as important here than the middle of the field, since each yard moves you 10% closer to 6 points
Short yardage situations is also an area where Notre Dame should be VERY run-heavy
They were dominant in these situations, which makes sense when 3-4 of the offensive line will be drafted this year
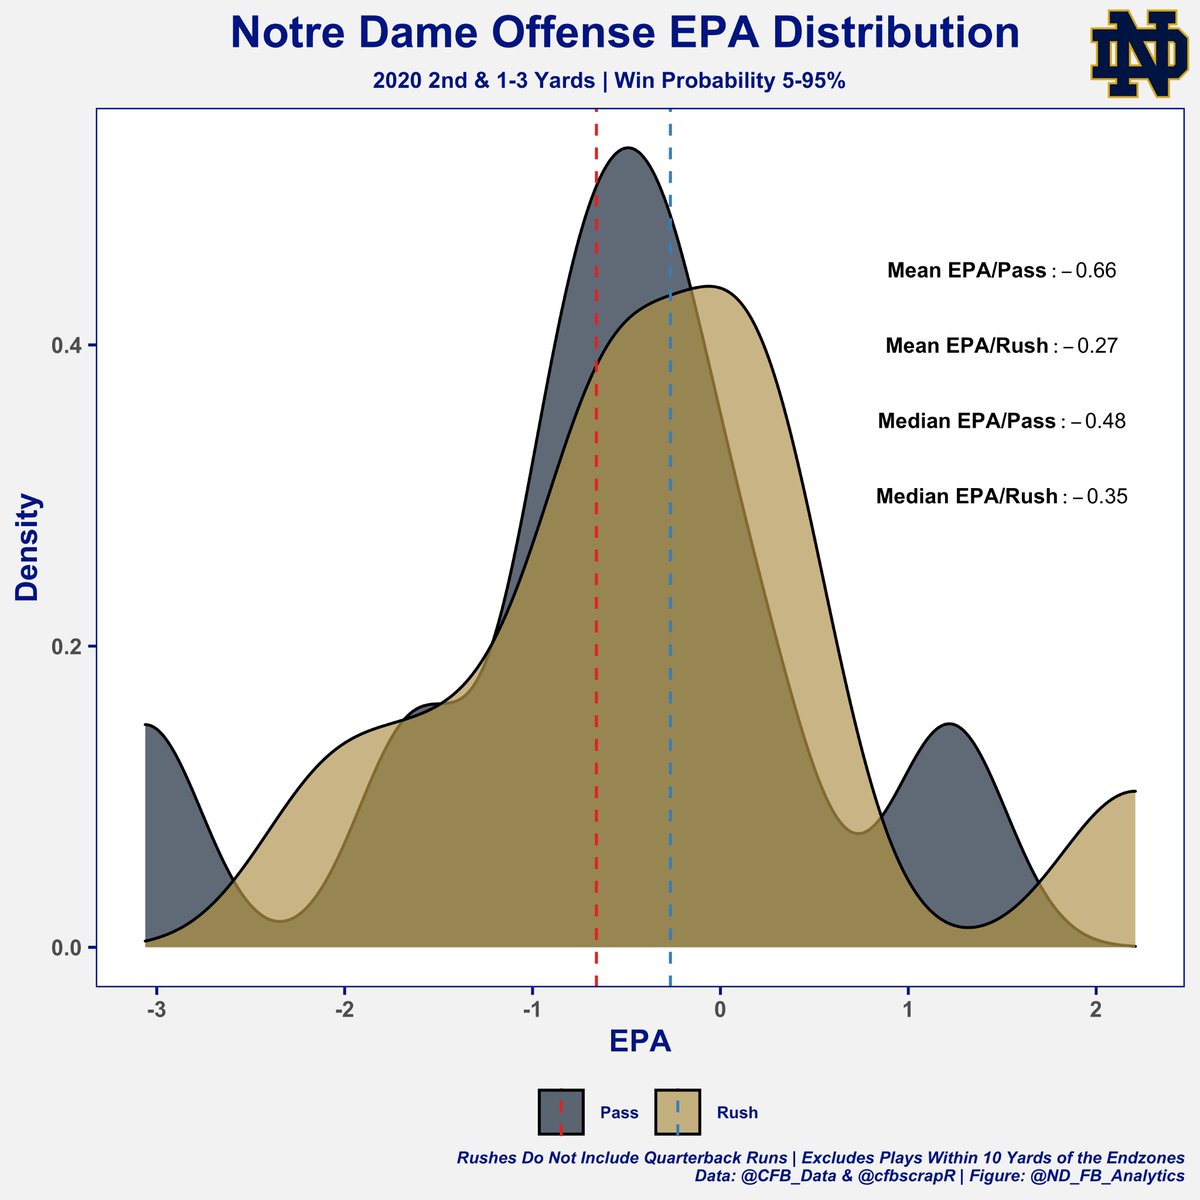
This is also why Notre Dame should be more aggressive throwing on 2nd & Short
They were dominant in these situations, which makes sense when 3-4 of the offensive line will be drafted this year
This is also why Notre Dame should be more aggressive throwing on 2nd & Short
TBF, Notre Dame wasn't good in these situations running or throwing but it should be a focus point in the offseason
Because they are so good on 3rd/4th & Short and conversion is as close to a guarantee as you can get in football, it's the perfect time to take a shot downfield
Because they are so good on 3rd/4th & Short and conversion is as close to a guarantee as you can get in football, it's the perfect time to take a shot downfield
It needs to be drilled into the QB's head that he absolutely cannot take a sack. Ian Book would sometimes do this which defeats the purpose
If the throw is not there and you can't pick it up with your legs, throw the ball away and let the maulers up front pick it up on 3rd Down
If the throw is not there and you can't pick it up with your legs, throw the ball away and let the maulers up front pick it up on 3rd Down
Notre Dame was ELITE rushing the football close to the end zone and in short yardage
They were anything but in all other situations
If that improves then we will be the biggest supporters of RTDB
But all we advocate for is to do more of what you're good at, and that is passing
They were anything but in all other situations
If that improves then we will be the biggest supporters of RTDB
But all we advocate for is to do more of what you're good at, and that is passing
METHODOLOGY
The graphs represent the total % of plays so the shaded area adds up to 1
If you pick a point on the X-Axis and draw a vertical line, the shaded area to left of the line would represent Y% of plays that resulted in less than Z EPA, and the reverse to the right
The graphs represent the total % of plays so the shaded area adds up to 1
If you pick a point on the X-Axis and draw a vertical line, the shaded area to left of the line would represent Y% of plays that resulted in less than Z EPA, and the reverse to the right

 Read on Twitter


