HS2 receives wide criticism in the green community, opposing it is even Green Party policy. Why? The crux seems to be claims of carbon neutrality: High-speed rail is seen internationally as a low carbon transport mode, but HS2’s own work undermines this view. What is going on?
We’ve recently seen a stories of “HS2 not carbon neutral after 120 years”, based on HS2 ltd’s own data used to criticise the scheme. It became an issue in 2020, but was hiding in plain sight since the 2013 environmental statement and was explicitly stated in 2017’s Phase 1 bill.
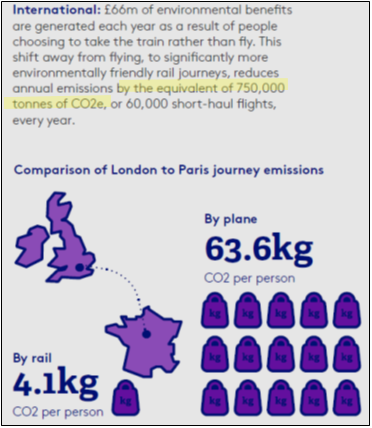
This is strange. It goes against global experience and HS2’s earlier data. For example HS1 and Eurostar, celebrated by Friends of the Earth and Greenpeace, take 11M passengers a year from air – saving 750,000 tCO2e and offsetting the Paris-London line’s construction in 13 years.
So why the discrepancy and does it matter? Yes, because it provides a legal route to halt the scheme, like Heathrow 3rd Runway.
A new line’s carbon neutrality is determined by construction and operational emissions, and savings from switching passengers from dirtier travel modes.
A new line’s carbon neutrality is determined by construction and operational emissions, and savings from switching passengers from dirtier travel modes.
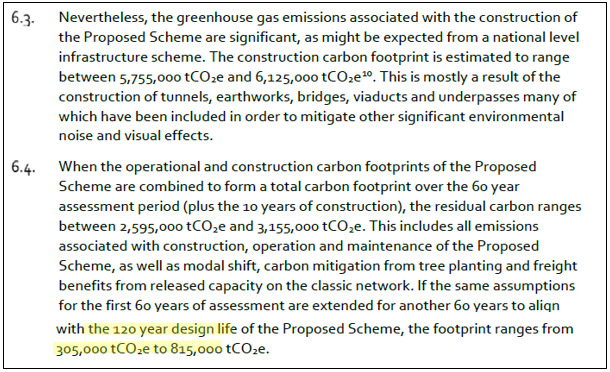
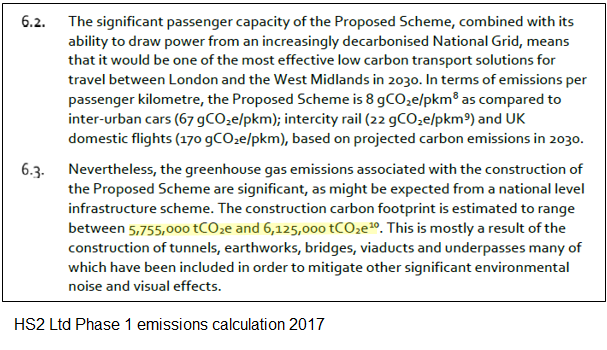
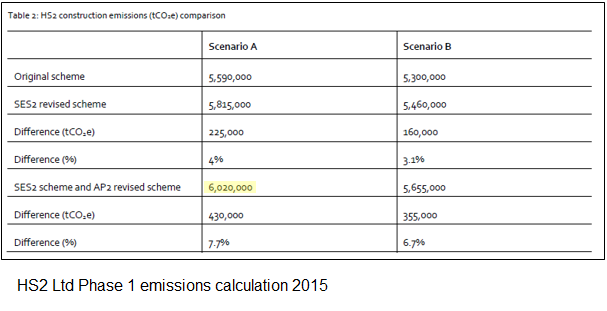
HS2 Ltd put construction CO2 at 1.2Mt in 2009. By 2013 it was 5.5Mt and later stabilised at 6Mt in Phase 1 bill amendments. Phase 2a adds 1.5Mt, so the scheme underway totals 7.5Mt. Why was HS2’s 2009 figure so low, when 2009 Network Rail data closely matched the 2017 value?
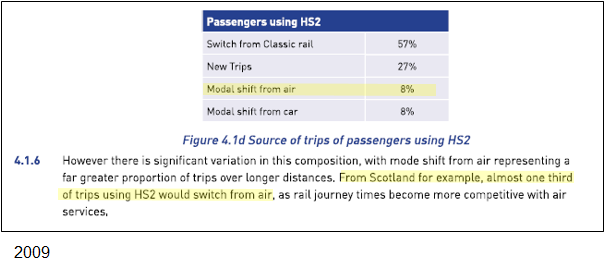
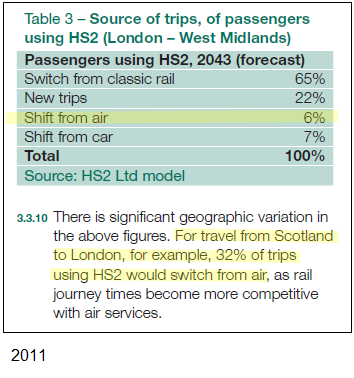
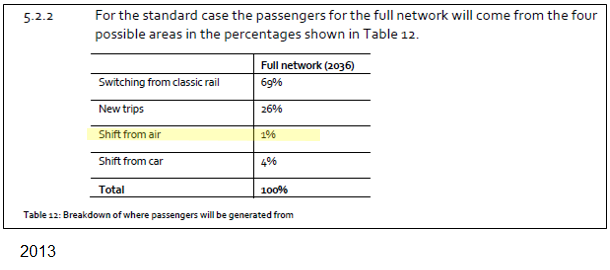
To offset 7.5Mt needs a swing to rail, particularly from air. In 2009 HS2 was predicting 8% (4.2M pa) of passengers would come from air. By 2011 this was 6% and by 2013 it fell to 1% (876k). Taking the total rail/air market for HS2 destinations, this is a 7% modal shift to rail.
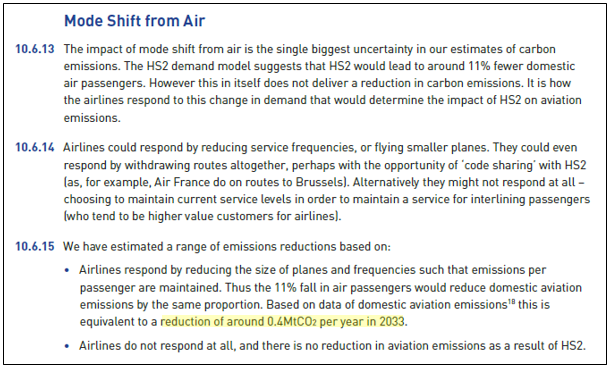
In earlier projections HS2 state a third of (1.6M) passengers on London-Scotland trains shift from rail. This contributes to a 10% drop in UK domestic aviation and a 0.4Mt CO2e pa reduction in emissions. This would have offset construction emissions in 19 years.
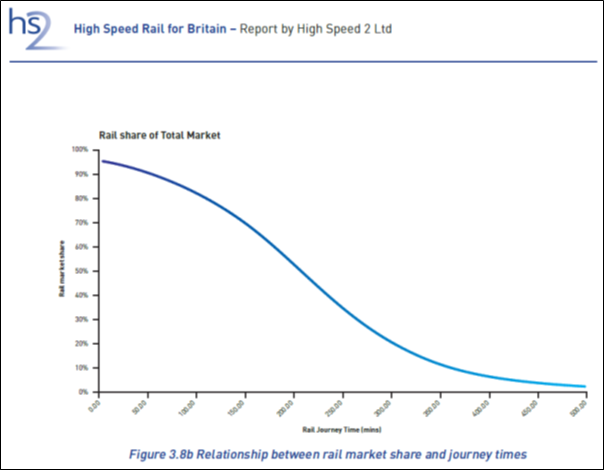
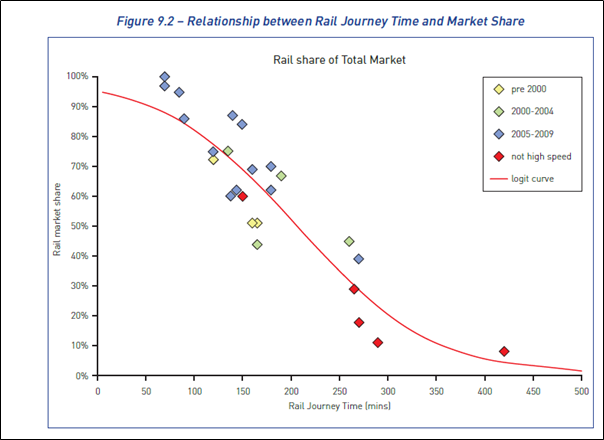
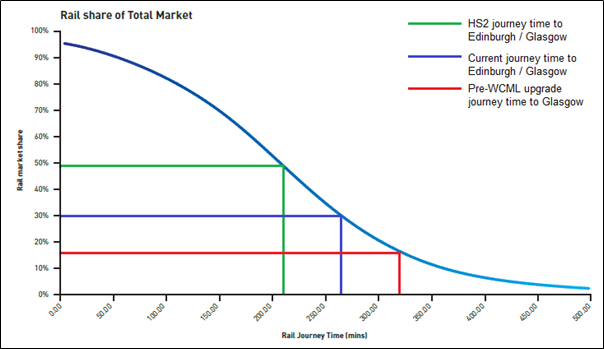
However in the same documents HS2 show a well-known journey time/market share curve that has been proven true in other markets, including London-Paris. Based on HS2’s timings vs today, this shows a 15% swing in London-Manchester and 20% swing in the larger London-Scotland market.
From HS2’s own data, shift to rail from these air routes alone offsets construction emissions in 48 years – ignoring all other benefits. Yet by 2013 this became 1% and 120 years. What changed?
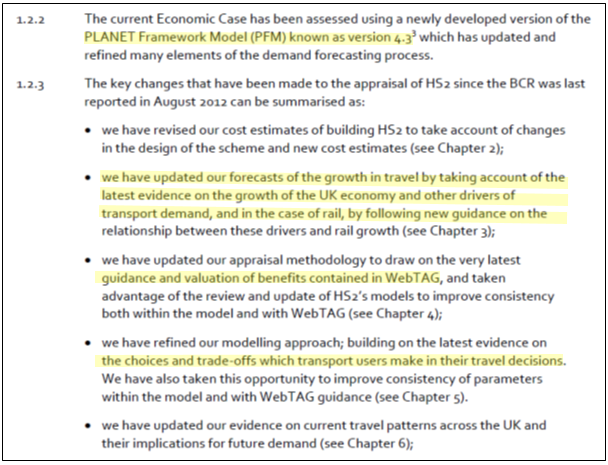
Demand for HS2 is based on a computer model called PLANET. The was overhauled for 2013:
Demand for HS2 is based on a computer model called PLANET. The was overhauled for 2013:
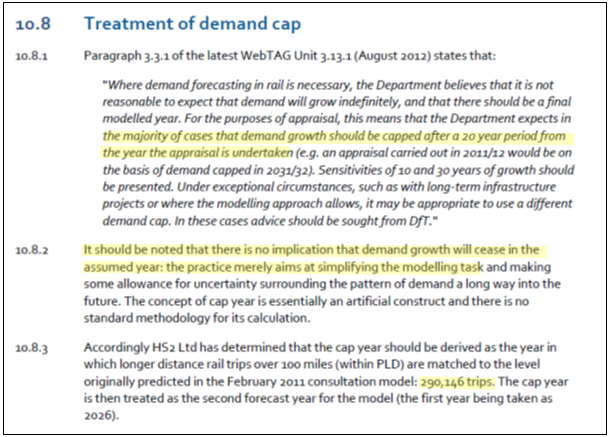
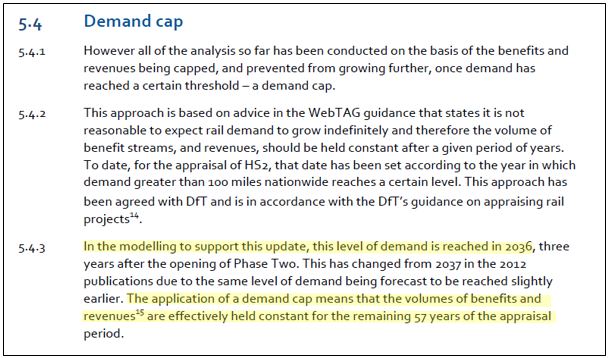
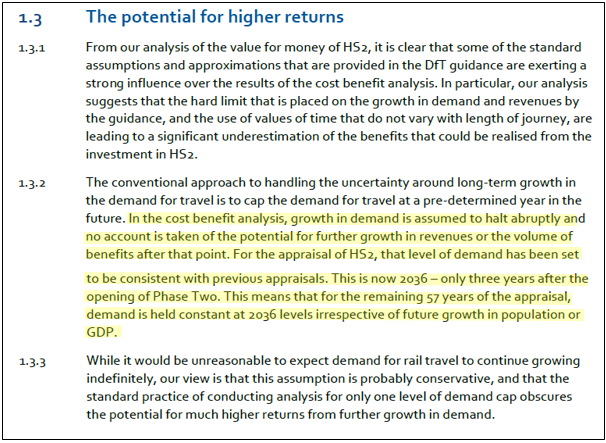
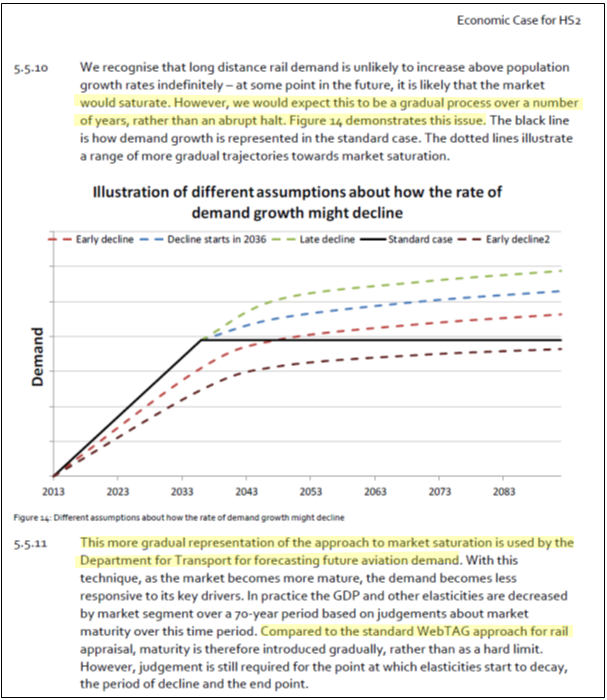
HS2 don’t publish the model but do a description and underlying assumptions. One change is DfT guidelines on modelling introducing an artificial demand growth cap in 2036. This is both different from aviation modelling and does not account for population growth.
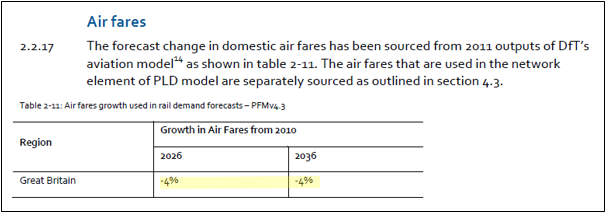
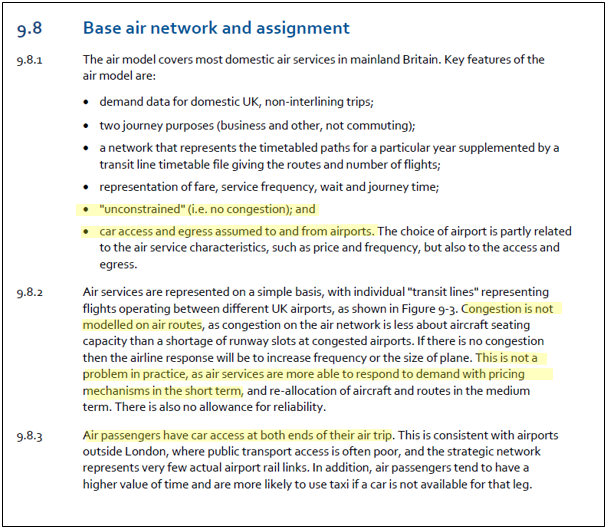
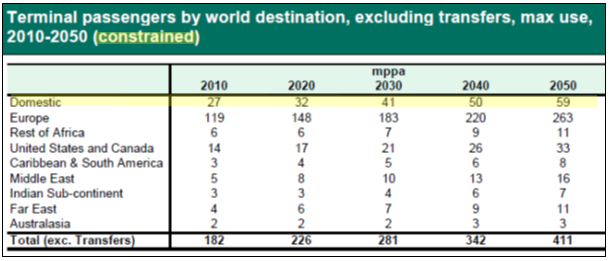
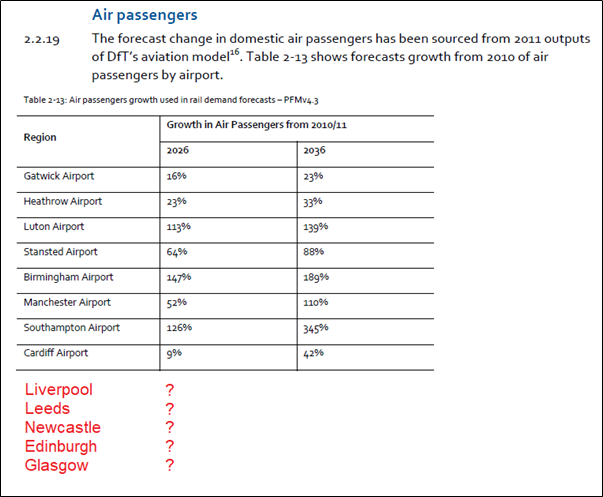
Another change is the introduction of DfT 2013 Aviation Forecast data to the model. HS2 use unconstrained growth data, assuming flights grow without airport capacity restrictions. They assume fares will cap demand as necessary, but elsewhere assume a fall in airfares.
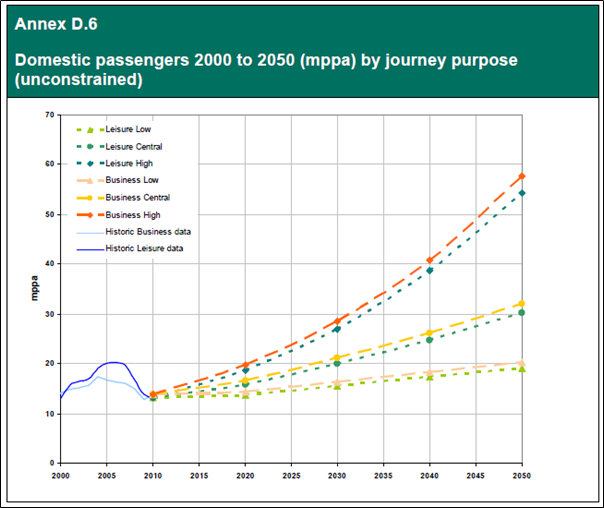
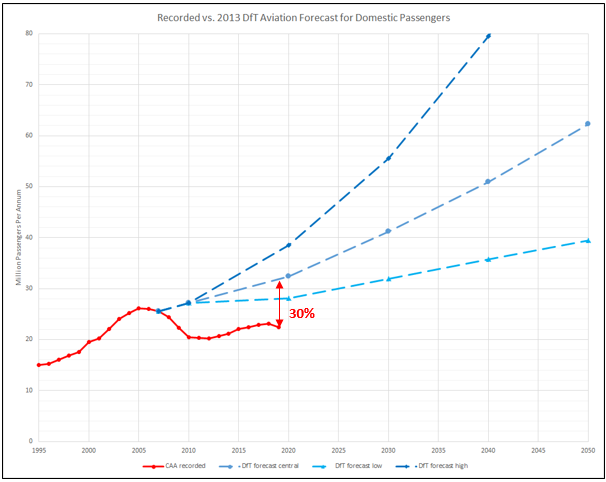
DfT’s 2013 report took 2007 data and extrapolated growth to 2010 as a starting point. They then projected a growth in domestic, international and total airport demand to 2050. The uncritical use of this data by HS2 appears to be one factor influencing the 1% from air result.
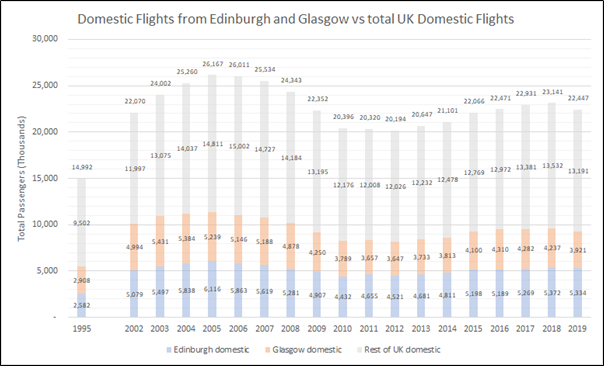
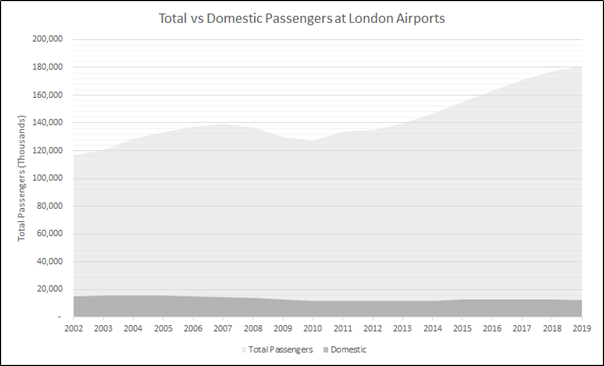
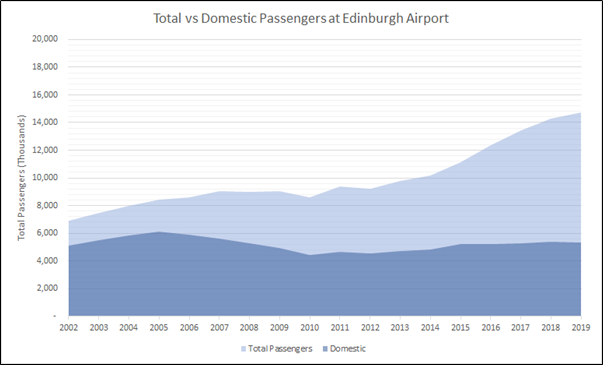
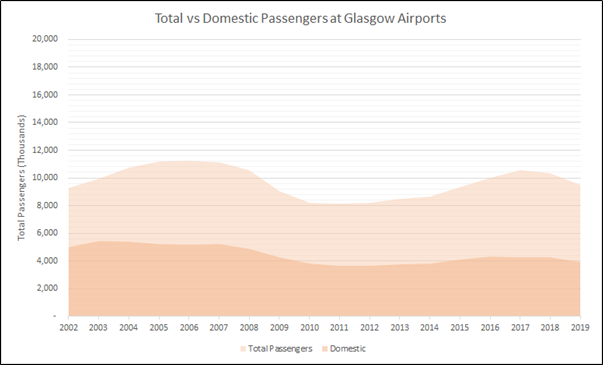
On one hand, DfT underestimate total demand, with London airports already close to their 2030 forecast and Glasgow and Edinburgh exceeding it. But they massively overestimate domestic capacity, as pax have remained close to 22M pa for 20 years, 30% below DfT’s forecast for 2020.
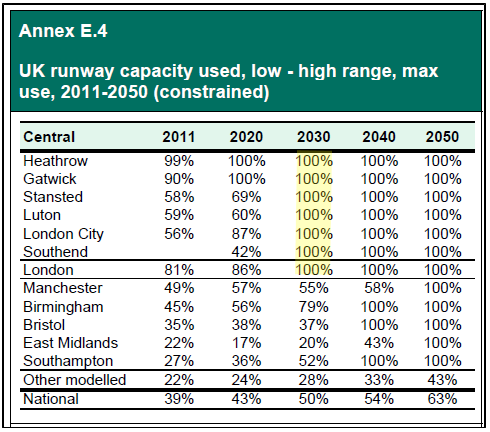
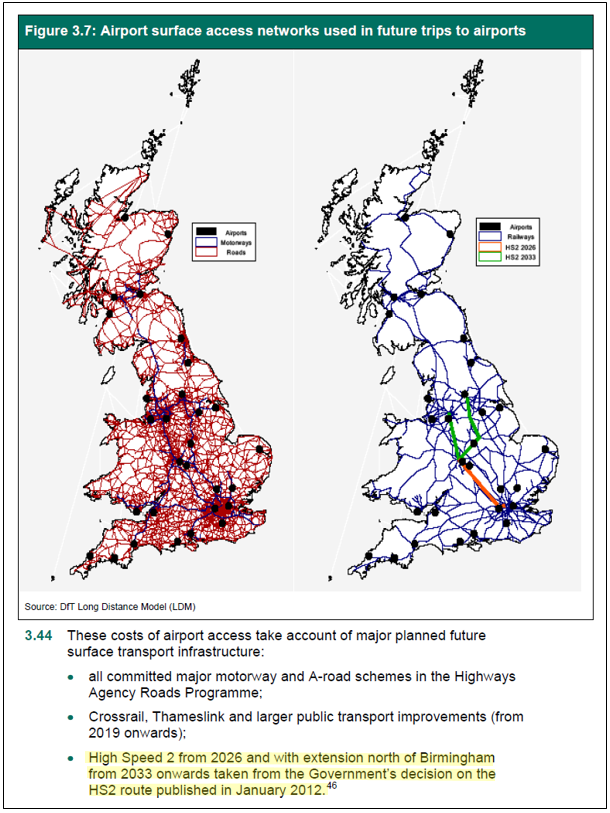
DfT’s report shows all London runways at 100% by 2030, yet HS2 model unconstrained aviation growth. Furthermore, DfT’s report is aware of HS2, but does not model a reduction – a vicious circle and demonstrably wrong by 2013. It is not even clear HS2 model northern airport demand.
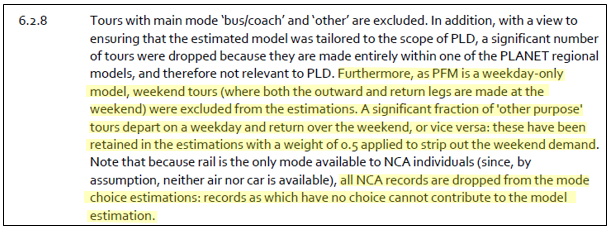
There are other bizarre assumptions: Weekend demand is not modelled (thus skewing effect of leisure flights, half the market), air passengers assumed to have a car (45% of Londoners do not) but the biggest assumption is no change to aviation demand from introduction of HS2.
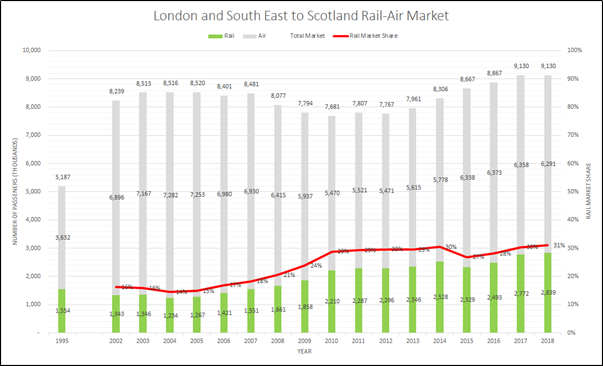
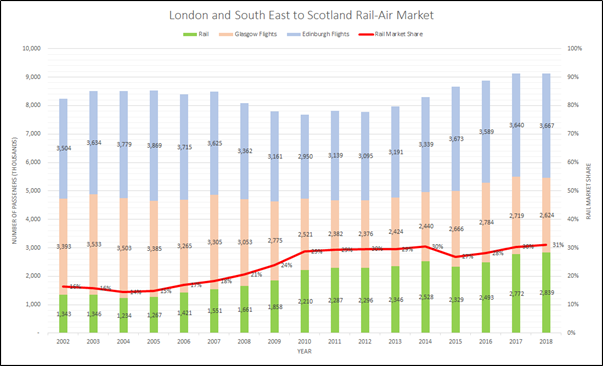
It's clear from the data domestic aviation is supressed by terminal capacity at London. However rail has grown, particularly on London-Scotland routes. Market share grew from 15% to 30% immediately after the mid-00s WCML speed upgrade, exactly in line with the demand curve above.
After aviation saw huge growth in the late 90s, in absolute terms London-Edinburgh routes have flat lined while London-Glasgow lost 1M pax when rail became 50 mins faster. Rail more than doubled to near 3M. This trend was already apparent by 2013, so why did HS2 ltd ignore it?
Shift from classic rail to HS2 also should be considered.
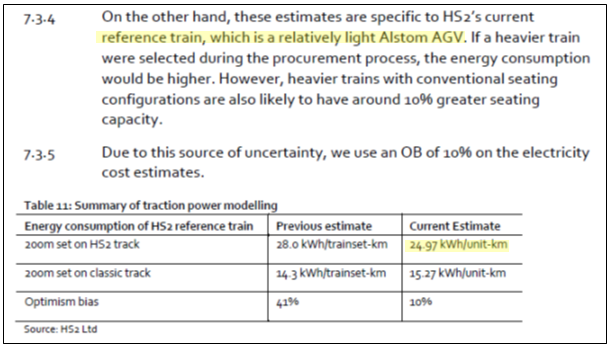
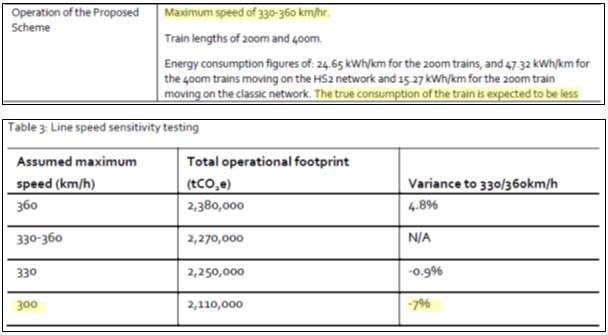
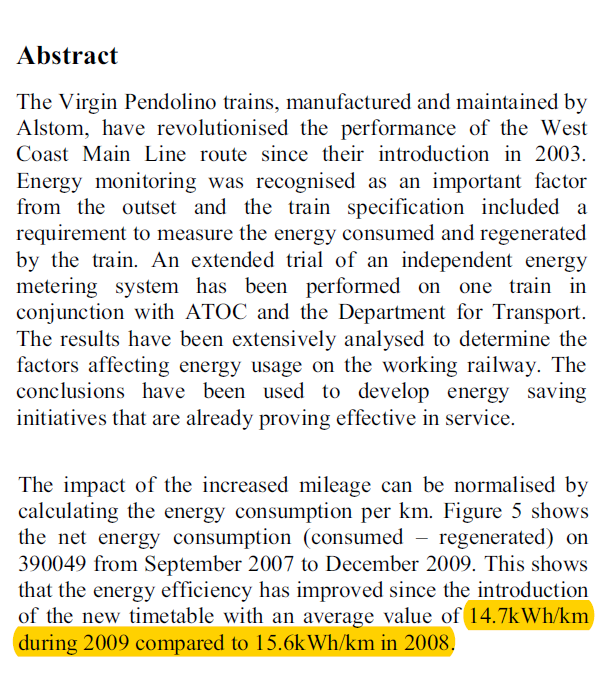
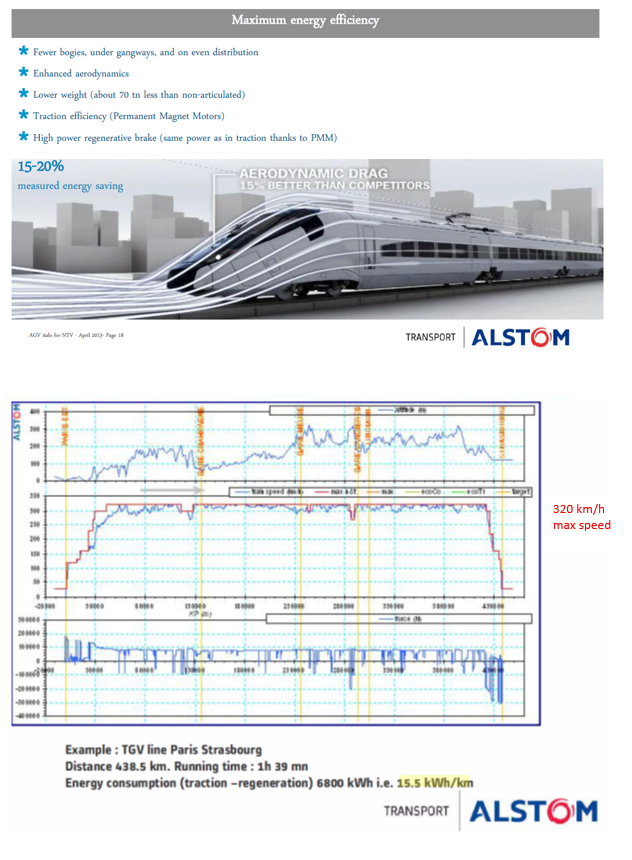
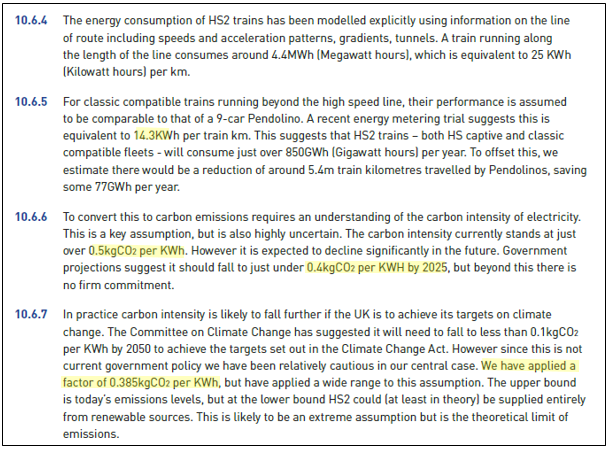
HS2 use the AGV with 24.65 kWh/km energy use as a reference train. At 300km/h this is 7% lower (23 kWh), but Alstom reported AGV energy use of 15.5 kWh at 320km/h, similar to a 200km/h Pendolino today. Why the difference?
HS2 use the AGV with 24.65 kWh/km energy use as a reference train. At 300km/h this is 7% lower (23 kWh), but Alstom reported AGV energy use of 15.5 kWh at 320km/h, similar to a 200km/h Pendolino today. Why the difference?
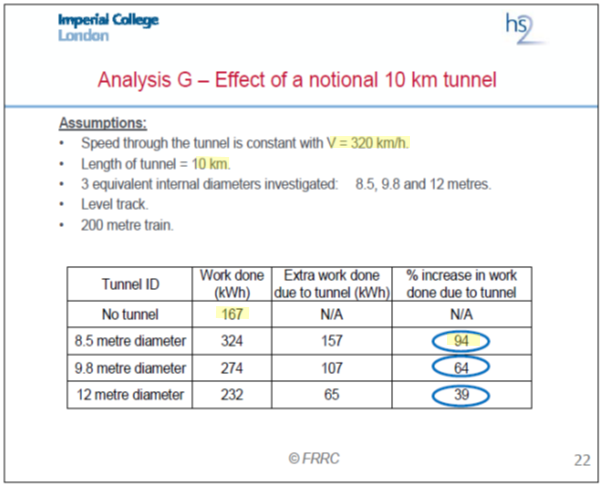
Tunnels are one possibility. Modelling shows 94% energy increase from 8.5m tunnels, but HS2 planned 8.8m tunnels for 360km/h. HS2 use a 1.8 tunnel uplift, so over the 225km route average use is 16 kWh/km, resulting in 0.3g/pkm extra on 2020 UK grid CO2. The difference is minimal.
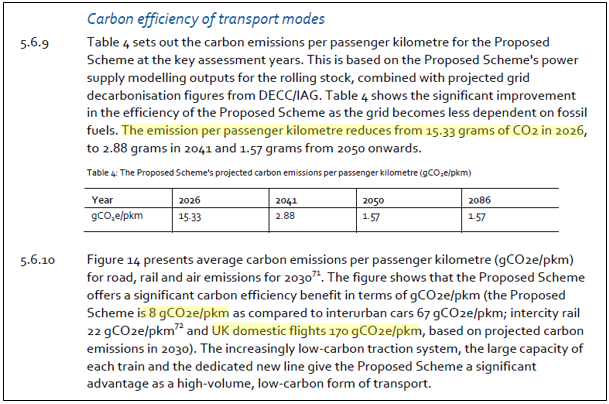
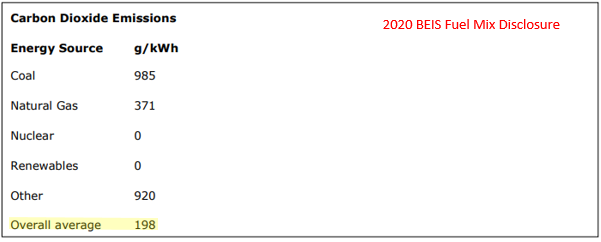
HS2 initially used a very conservative grid CO2 intensity forecast of 385g/kWh. The UK is already at 198g/kWh and falling. That means CO2 emissions are <7g/pkm now, not 15.33g/pkm in 2026 as stated. When the UK reaches French grid levels, as they must, emissions will be 1g/pkm.
Criticism that HS2 attracts passengers away from classic rail, increasing emissions, is therefore unfounded. The energy use of a modern high speed train per seat-km is no worse than the classic Pendolino, due to that latter's weight, aerodynamics and more frequent acceleration.
Emissions for domestic aviation is stated to be derived from London airport data in the DfT report. However the only data shown is for short and long haul seat-km. It appears HS2 calculated an average for all flights while acknowledging Defra publish guidance on domestic flights.
Shift from aviation has a big influence on HS2’s carbon neutrality. Using HS2’s own data for aviation (170g/pkm) and train (10g/pkm) emissions and modal shift it takes 48 years to cancel construction CO2 when *only* considering London – Manchester, Edinburgh and Glasgow flights.
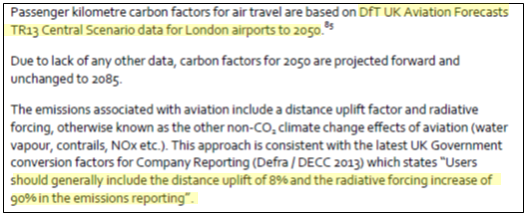
However DEFRA and BEIS reporting guidelines for aviation are far higher – 283g/pkm including radiative forcing – and this cancels HS2 construction emissions in 28 years, even assuming no growth from 2019 air or rail traffic levels and no change in 2020 UK grid CO2 intensity.
Taking these effects together – skewed model of travel mode choice, uncritical acceptance of air growth and decarbonisation, conservative train energy use and grid emissions – it is no wonder the output is pessimistic. In reality HS2 will be carbon negative long before 120 years.
The numbers above only look at 3 air routes. They do not account for modal shift between London-Newcastle, Birmingham-Edinburgh, Birmingham-Glasgow and other regional routes, plus shift of freight from road to freed capacity on the classic network.
HS1, the Channel Tunnel and line to Paris are already carbon neutral. The size of the London-Scotland market is bigger than the Paris market: From a CO2 viewpoint a 360km/h, 2.5hr HS2 Phase 3 to Scotland would allow the whole scheme to achieve an even bigger model shift from air.
The entire environmental and economic case for HS2 hinges on a computer model which was changed mid-design. The code is not published, so who peer reviewed this? The assumptions used to drive it are demonstrably wrong and the design of the entire £62bn scheme is affected by this.
By their own admission the DfT's rules prevent the model showing passenger growth just 3 years into a 120 year scheme. It is no wonder the shift from air needed to offset emissions doesn't occur - the inputs to the model would never allow it.
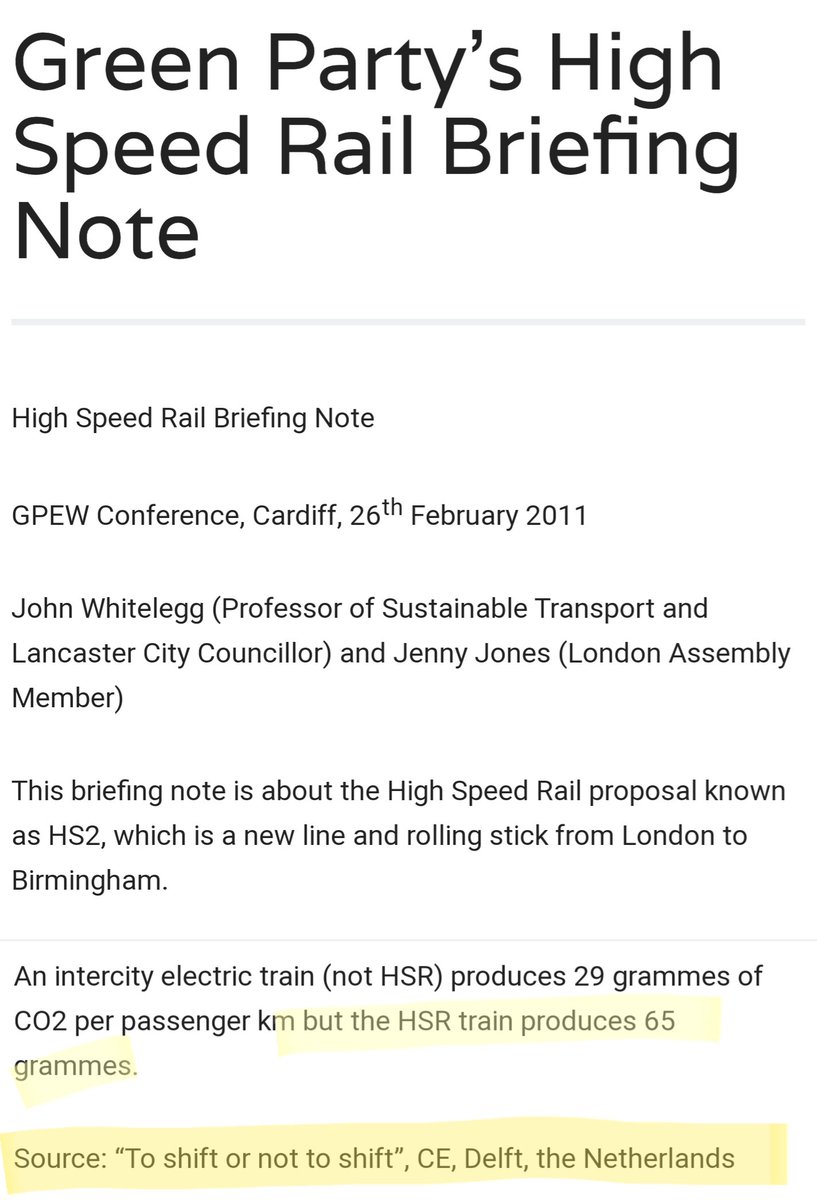
There is another factor that explains hostility from the Green Party in particular. At their 2011 conference they were briefed that a high speed train produces 65g/p-km CO2. This figure came from a single 2003 report from CE Delft, a Dutch consultancy. This report contains an
energy use of 0.53MJ/seat-km (or 147Wh). 377 seats gives the reference train away as a 1993 TGV Réseau, and that energy use is 5x higher than a modern unit. Combined with decarbonisation of the UK grid, the claimed emissions are therefore 10x the value HS2 would produce today.
One has to ask why a professor would provide a briefing citing just one old commercial consultants report, when by 2011 conference papers on the Alstom AGV and validated real world Eurostar data were available?
It's time the Green Party admitted they were led up the wrong track.
It's time the Green Party admitted they were led up the wrong track.

 Read on Twitter