Most will know, but for those that don’t (xG (Expected Goals)) basically put a number on what we already know. The closer and more central to goal = increased chance of scoring. The model I’ve put together takes into account, distance/angle/from corner/from direct free kick.
More sophisticated models include further parameters that reflect a ‘truer’ value for the shot taken..as such this model will most probably under value shots (but can act as a guide!)
Anyway. Match plot vs Rochdale. Similar to the Lincoln game last year, Oxford scored a load of low xG shots...probably won’t happen every week!
Looking at the squad, Taylor leads the way for non-penalty xG...with Agyei in second  . Shodipo banging in 7 goals from from his xG
  .
.
 . Shodipo banging in 7 goals from from his xG
  .
.
Looking at locations: Agyei once again...plus some early signs from Winnall. Some interesting trends from Henry on the right edge of the box. Take Taylor out the squad and we lose a fair amount of shot volume and threat
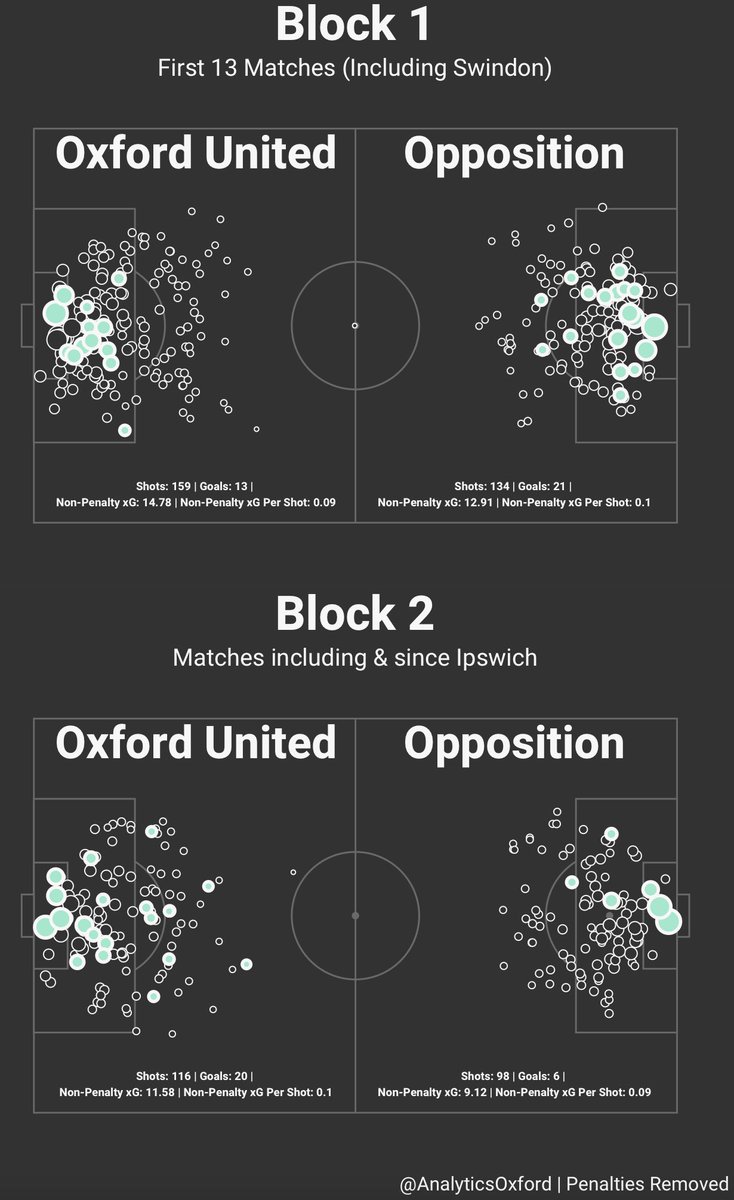
Swindon is seen as a watershed moment this season. Comparing the 13matches including Swindon vs the matches since. Interesting flip...in the first block 21 goals conceded from ~13xG whilst scoring around our expected rate
In the second block, this has flipped.... #OUFC with 20 non penalty goals off ~12xG. The second block obviously contains fewer matches than the first, so will be interesting to see off the over performance is sustained through the next 4 matches.
Anyway, will keep having a mess about - give me a shout if there’s anything specific!

 Read on Twitter


