The #REACT study by @ImperialCollege has reported its final results from Round 8 of its infectivity survey. It reports "suggestion of a decline" during the period 6th to 22nd Jan, notably shallower than we are seeing in PHE daily test figures.
A thread to summarise results. 1/11
A thread to summarise results. 1/11
Overall it reports average infectivity levels of 1.57% over the period, with an R of 0.98. There were 2,282 positive results out of 167,462 samples collected by random sampling methods.
2/11
2/11
The modelling suggests a slight increase in the first period, with a more rapid fall in the last few days. To counter the omission of data in late Dec, it's refined the model by using the ONS survey shape over that period, but it doesn't change the shape much after Jan 6.
3/11
3/11
Regionally, there's quite a contrast, with the SW falling fastest, E Midlands growing, and others less clear.
The figures for London, East and SE, so close to 1, are maybe surprising, given other evidence, such as recent falls in admissions in those regions.
4/11
The figures for London, East and SE, so close to 1, are maybe surprising, given other evidence, such as recent falls in admissions in those regions.
4/11
In absolute terms, we can see that London still has the highest prevalence by some margin, three times the rate in Yorkshire and the S West. The vertical lines are confidence intervals, so you can see the others are "in the pack", with less clear distinction between them.
5/11
5/11
You can see from the wide confidence interval bands that there's more difficulty in many regions in trying to judge direction by region, consistent with the estimates of R close to 1. Though the fall in London looks clearer here than the R of 0.97 might suggest.
6/11
6/11
By age we can see a clear trend with young adults having highest infectivity, with a gradual decline over age. With schools closed, those age groups are lower than young adults, although still quite high (possibly the "one day opening" on the 4th had an adverse effect?).
7/11
7/11
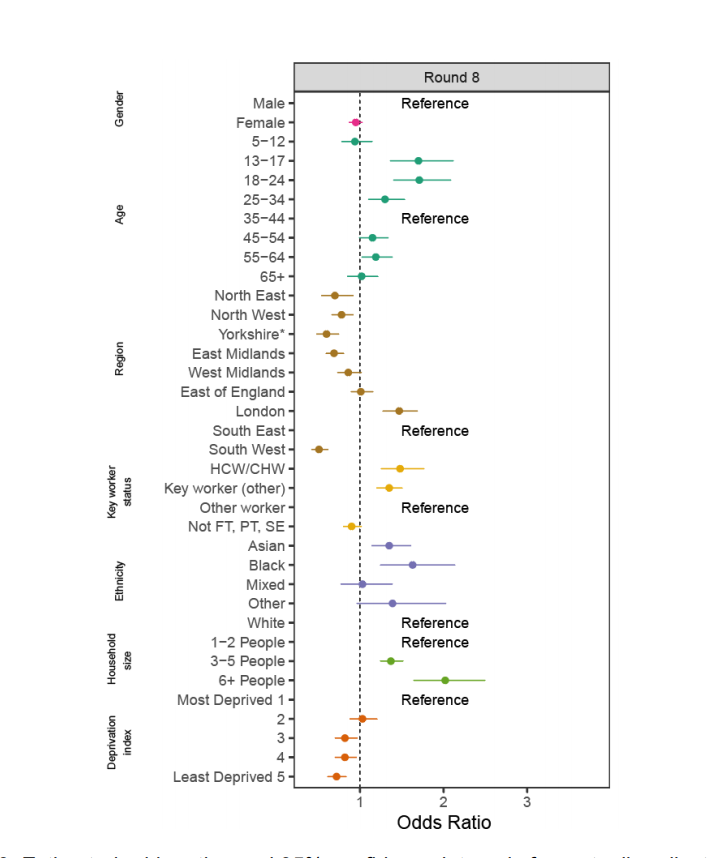
A nice visual here of various demographic variations, using odds ratios with a reference point for each group. Note the HCW increased risk, along with the same concerning variations of ethnicity and deprivation we've seen throughout the pandemic.
8/11
8/11
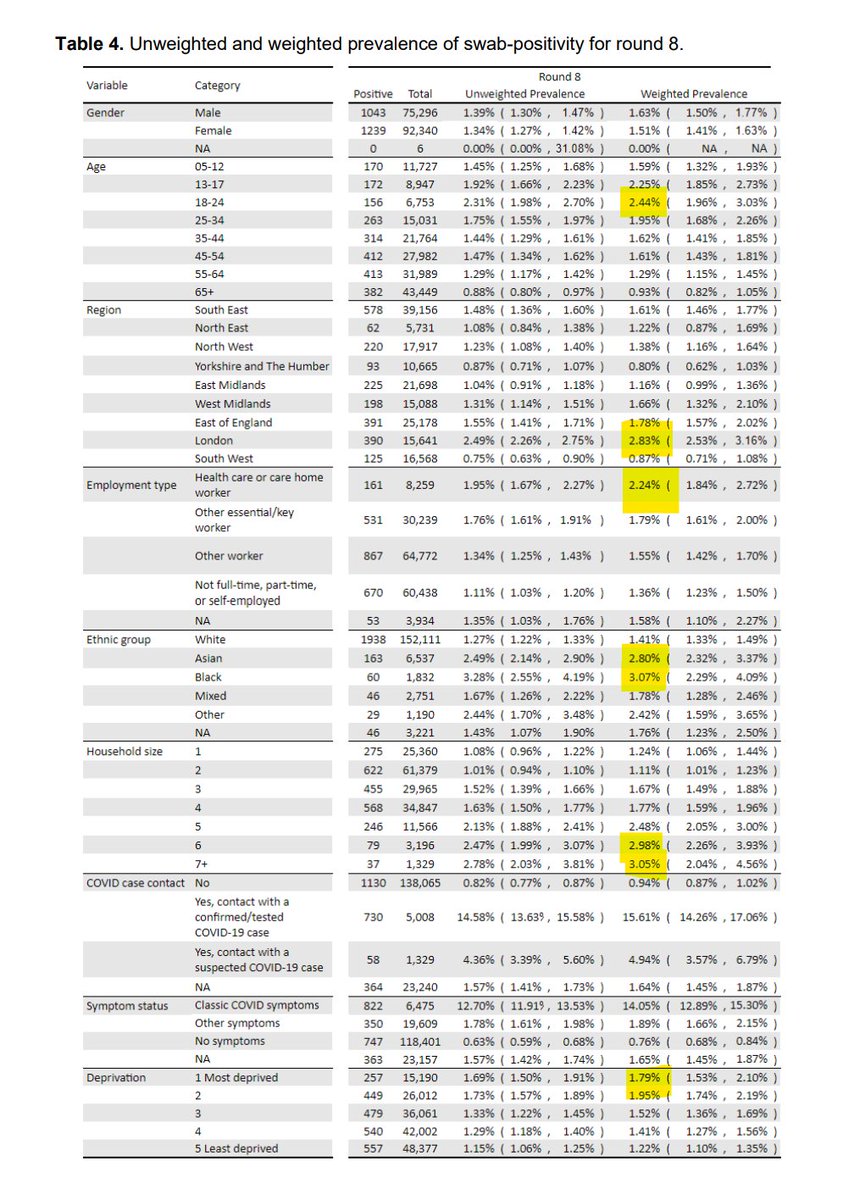
If you want the detail behind the differences, here's a very busy table. I've highlighted some of the key increased risks, but if interested you might want to read the underlying report for more information.
9/11
https://spiral.imperial.ac.uk/bitstream/10044/1/85703/10/react1_r8_full_preprint_1.1.pdf
9/11
https://spiral.imperial.ac.uk/bitstream/10044/1/85703/10/react1_r8_full_preprint_1.1.pdf
REACT is one of a number of surveillance methods (PHE, ONS, Zoe) being used to assess the latest position, and they are more valuable together than in isolation in forming an overall view.
The survey ended on 22nd, so great work to turn the analysis around in 6 days!
10/11
The survey ended on 22nd, so great work to turn the analysis around in 6 days!
10/11
Finally, thanks to all at @imperialcollege, @Ipsosmori and partner organisations, who were involved in the survey in some way, not forgetting all those who agreed to participate.
11/11
11/11

 Read on Twitter


