Random sample prevalence studies, such as the one out today (REACT-1) or the one published by the ONS, form an extremely valuable piece of the puzzle, but IMHO they are not well-suited to estimating a current value of R - judging whether the disease is rising or falling now.
1/x
1/x
The latest publication from the REACT-1 survey https://www.imperial.ac.uk/medicine/research-and-impact/groups/react-study/real-time-assessment-of-community-transmission-findings/ has lots of incredibly useful information and they are doing a fantastically valuable job, but I think predicting recent growth/shrinkage of disease levels is not their strongest suit,
2/x
2/x
and maybe shouldn't be taken as an indicator of current trends. Random sample prevalence surveys are fighting against several factors if they want to measure trends: (i) they need to find lots of infected people to get an accurate result but disease prevalence is only 1-2%,
3/x
3/x
(ii) the kind of growth/falling trend you want to measure is quite small (R=0.8 is approx 4% shrinkage per day), and (iii) they are measuring prevalence not incidence. Prevalence is the number of people who currently have the disease. Incidence is the number of people
4/x
4/x
who are newly infected in a day (say). Incidence is the more dynamic/recent quantity: if you get infected then you will contribute to prevalence over the next few weeks. So prevalence is the roughly the integral of incidence (with a decay factor). If you try to invert
5/x
5/x
the process, to go from prevalence to incidence, then you need more accuracy because you're measuring change in prevalences - it's ill-posed in the jargon. So either you need more accuracy, which means more samples, which means more delay, or you accept you are dealing with
6/x
6/x
prevalence only, which is intrinsically a delayed quantity.
What are random-sample prevalence surveys good at? They are great for getting a longer term reliable measure of how many people, including asymptomatic people, have been infected. This is vital to understanding
7/x
What are random-sample prevalence surveys good at? They are great for getting a longer term reliable measure of how many people, including asymptomatic people, have been infected. This is vital to understanding
7/x
the disease dynamics because there's a huge difference in immunity if 10% of the country has been infected vs if 50% has. We need random-sample surveys to make sure we're not missing asymptomatic people, and also to catch the kind of people who are less likely to come
8/x
8/x
forward for a test.
Here's an analogy: (analogy disclaimer: not entirely fair or perfect) You want to know how fast you are going down the motorway, but you're not sure if your speedometer is calibrated correctly. So you call your mates who have a surveyor's wheel and
9/x
Here's an analogy: (analogy disclaimer: not entirely fair or perfect) You want to know how fast you are going down the motorway, but you're not sure if your speedometer is calibrated correctly. So you call your mates who have a surveyor's wheel and
9/x
they turn up to measure your distance from the previous junction, and an hour later they measure your distance again. One distance/time calculation later and you have your speed, though about an hour after you wanted it. However, you were also looking at your speedometer
10/x
10/x
and armed with the true speed measurement from your surveyor mates, you now have a calibrated speedometer which will give you timely speed readings whenever you glance down. In other words, these slow random-sample prevalence results are very useful (inter alia) for
11/x
11/x
calibrating models and making sure they are producing sensible answers.
12/end
12/end
PS I'd guesstimate the effective delay in the whole process to be of the order of a month, meaning it can give tolerably accurate R estimates from about a month ago. PCR positivity lasts for a couple of weeks on average and you need to gather data for ~2 weeks too. 2+2=4 weeks.
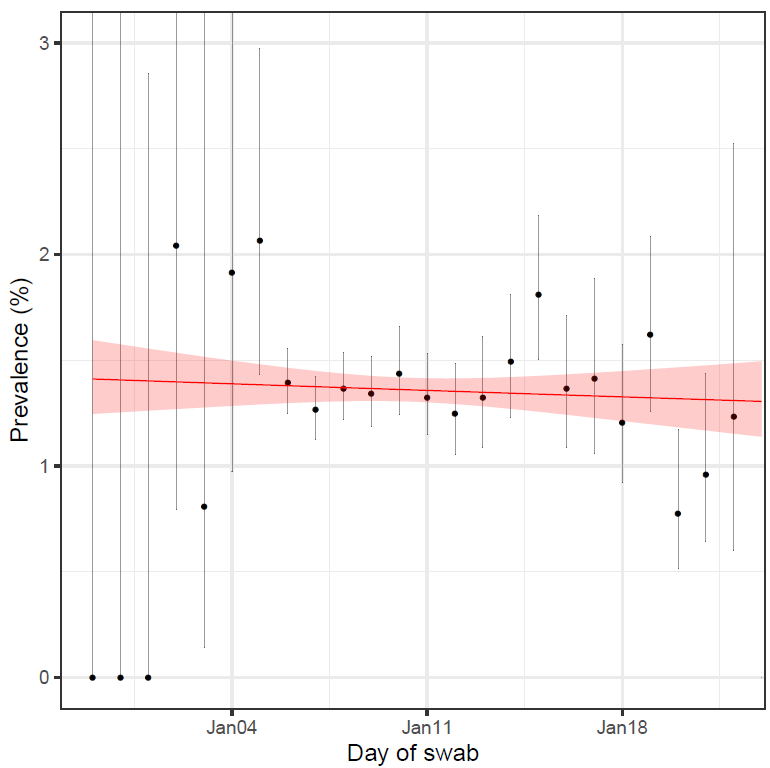
It may look like there is up-to-date information from the last sample, but that's an illusion. The information from any one day is too weak to infer anything from, so they build a model that combines >=2 weeks of observations, and assumes a simple form like constant growth here:
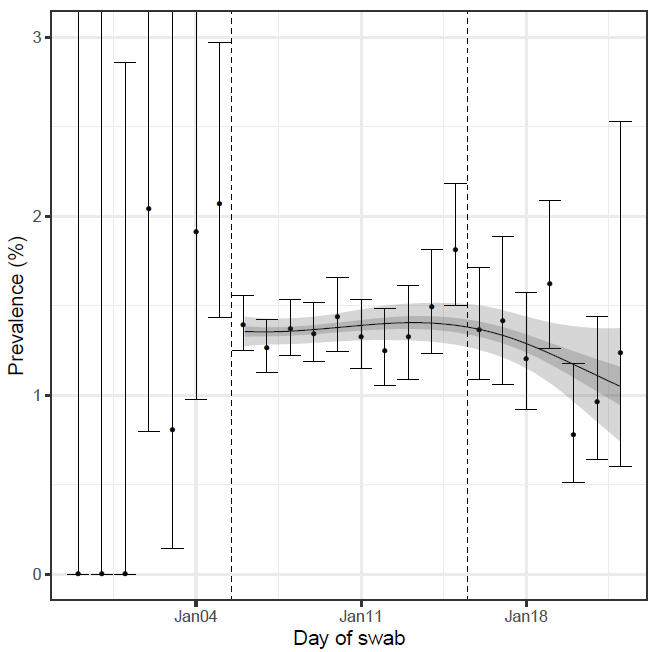
They also cleverly try to get more up-to-date information by fitting non-constant growth, but the error range is wide because it's effectively trying to extract information from the last few observations. Admirable to squeeze as much as possible from the data but there is a limit
Probably I should have said 3 weeks total, not 4, because average backlog from a 2 week survey is 1 week, not 2.

 Read on Twitter


